A transparent reconstruction of crop-water demand for the Hare Irrigation Project using FAO CROPWAT climate procedures, modern climate and SWAT checks, and a direct comparison with the FAO-based water-demand methodology used in the original 1995 Hare design.
Crop water requirement is estimated by first defining the atmospheric demand for water through reference evapotranspiration (ETo), then adjusting ETo for the characteristics and growth stage of each crop using the crop coefficient (Kc). Rainfall that is effectively stored in the crop root zone reduces the amount that must be supplied by irrigation. The remaining net irrigation requirement is increased to account for conveyance, field and application losses before the scheme diversion requirement is established.
Temperature, humidity, wind and sunshine/radiation define reference evapotranspiration.
Kc varies through the initial, development, mid-season and late-season crop stages.
Only the portion of rainfall that becomes available within the crop root zone is credited.
The natural rainfall contribution is subtracted from crop evapotranspiration.
Losses in conveyance, distribution and field application are included to determine diversion demand.
Crop areas and planting calendars are combined to obtain monthly and peak scheme discharge.
Historic climate information for the Hare/Arba Minch area was obtained from FAO CROPWAT Online at approximately 6.03°N, 37.56°E and 1239 m elevation. The historic climatic normal refers to 1961–1990 and provides an independent reference against which the reconstructed climate and evapotranspiration analysis can be checked.
| Month | Rainfall (mm/month) | Wet Days | Tmin (°C) | Tmax (°C) | Tmean (°C) | RH (%) | Sunshine (%) | Wind (m/s) | ETo (mm/month) | ETo (mm/day) |
|---|---|---|---|---|---|---|---|---|---|---|
| Jan | 24 | 2.7 | 13.8 | 31.0 | 22.4 | 41.5 | 80.2 | 1.2 | 145 | 4.7 |
| Feb | 22 | 3.6 | 15.0 | 31.6 | 23.3 | 41.6 | 80.7 | 1.2 | 142 | 5.1 |
| Mar | 70 | 5.5 | 16.0 | 31.4 | 23.7 | 47.8 | 73.2 | 1.6 | 168 | 5.4 |
| Apr | 135 | 11.3 | 16.5 | 29.9 | 23.2 | 59.4 | 63.9 | 1.3 | 141 | 4.7 |
| May | 128 | 9.9 | 16.7 | 28.3 | 22.5 | 66.0 | 64.4 | 1.3 | 135 | 4.4 |
| Jun | 53 | 8.6 | 16.4 | 27.4 | 21.9 | 64.7 | 59.9 | 1.3 | 123 | 4.1 |
| Jul | 42 | 7.8 | 16.2 | 26.4 | 21.3 | 65.6 | 51.6 | 1.3 | 119 | 3.8 |
| Aug | 46 | 8.4 | 16.2 | 26.9 | 21.5 | 65.1 | 56.9 | 1.3 | 127 | 4.1 |
| Sep | 94 | 7.4 | 16.1 | 28.1 | 22.1 | 62.1 | 64.5 | 1.2 | 132 | 4.4 |
| Oct | 116 | 6.8 | 15.6 | 28.6 | 22.1 | 64.4 | 64.7 | 1.2 | 132 | 4.3 |
| Nov | 60 | 5.7 | 14.0 | 29.3 | 21.6 | 58.5 | 72.4 | 1.0 | 125 | 4.2 |
| Dec | 21 | 3.4 | 13.0 | 30.1 | 21.5 | 49.7 | 82.3 | 1.0 | 133 | 4.3 |
| Annual | 811 | 81.1 | — | 1622 | — | |||||
Source: FAO CROPWAT Online / AQUASTAT Climate Information Tool; historic climate normal 1961–1990, CRU CL 2.0.
The FAO historical climate normal and the SWAT simulation serve different purposes. The FAO value is a long-term climate reference, whereas the SWAT result represents the mean annual behaviour of the recent model simulation period. They should therefore be compared as independent checks rather than treated as observations from the same years.
| Parameter | FAO CROPWAT historic | SWAT simulation | Interpretation |
|---|---|---|---|
| Annual precipitation | 811 mm/yr | 1665.5 mm/yr | Different climatic periods, datasets and spatial representation. |
| Reference ETo / PET | 1622 mm/yr | 1570.7 mm/yr | Close magnitude; difference ≈ 3.2%. |
| Actual ET | — | 928.9 mm/yr | SWAT realized evapotranspiration. |
| Surface runoff | — | 267.63 mm/yr | Direct runoff contribution. |
| Lateral flow | — | 250.62 mm/yr | Subsurface lateral flow component. |
| Groundwater return flow | — | 182.06 mm/yr | Baseflow contribution to streamflow. |
The original Hare report estimated irrigation demand using FAO crop-water-requirement procedures available at the time. Reference evapotranspiration was estimated with a modified Penman method, and crop evapotranspiration was obtained by applying crop coefficients through four crop-development stages.
The reconstruction repeats the same physical water-balance logic using modern CROPWAT procedures, updated climate information, current crop/land-use evidence and independent checks from SWAT. This allows the 1995 engineering assumptions to be tested rather than simply reproduced.
| Component | Hare 1995 design | Current CROPWAT reconstruction | Purpose of comparison |
|---|---|---|---|
| Reference ET method | Modified Penman | FAO Penman–Monteith in CROPWAT | Check whether modern ETo magnitude and seasonality support the historical estimate. |
| Crop evapotranspiration | ETc derived from ETo and crop coefficient Kc | ETc = Kc × ETo | Retain the same physical basis while updating input data. |
| Crop stages | Initial, development, mid-season and late-season | Same four-stage FAO crop-development framework | Compare Kc curves, planting dates and crop calendars. |
| Net irrigation requirement | NIR = ETc − Pe, with effective-storage considerations | NIR determined from ETc and effective rainfall in CROPWAT | Compare the irrigation depth actually required at field level. |
| 1995 efficiencies | Ec 80%; Ea 70%; Ef 80%; Ep = Ec × Ea × Ef | Efficiency assumptions to be tested against the reconstructed system | Assess how conveyance and field losses affect gross demand. |
| Special 1995 assumption | ETc reduced by 20% because of the local humid/lake-and-tree environment | Not imposed automatically; modern climate data and model outputs are used to test the assumption | Determine whether the historical adjustment remains justified. |
| Scheme output | Monthly diversion requirement and irrigation discharge | Monthly CWR, NIR, GIR, peak demand and required discharge | Directly compare the resulting design demand and canal capacity. |
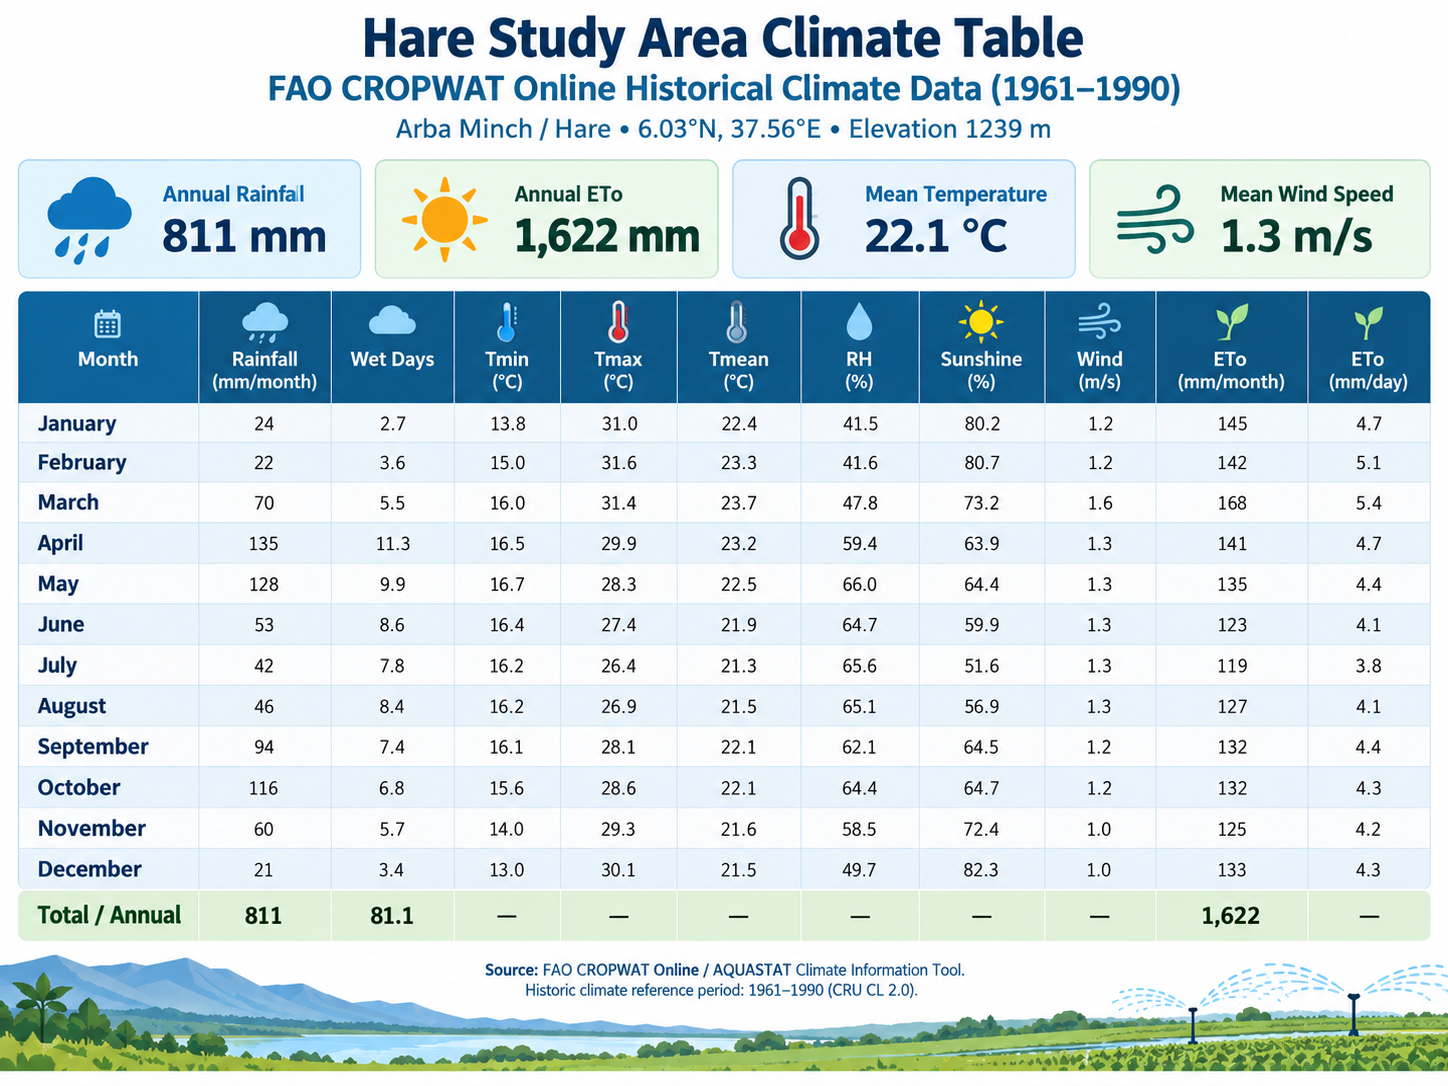
The figures below summarize the historic climate reference, the CROPWAT–SWAT cross-check, and the crop-water-requirement workflow. Use the forward/back controls to browse, or enlarge any image for full-screen viewing.
The next stage is to run the reconstructed crop pattern through CROPWAT. For each crop we will document the planting date, stage lengths, crop coefficients, rooting depth and soil parameters, then calculate crop evapotranspiration, effective rainfall and irrigation requirement.
Crop type, planting date, Kc values, growth stages and rooting depth.
Effective rainfall method, available soil water and irrigation scheduling assumptions.
Monthly ETc, effective rainfall and net irrigation requirement for each crop.
Gross requirement, peak demand, discharge and comparison with the canal supply limit.