This section is the geospatial and engineering-visualization
archive for HARE Revisited. It documents the project from terrain
and drainage through land use, soils, rainfall, command-area and
canal reconstruction, HEC-HMS design-flood modelling, SWAT
continuous watershed simulation and present sediment evidence.
The HEC-HMS reassessment is complete, with an accepted 50-year
event peak of 114.4 m³/s at the Hare Weir. SWAT watershed
delineation, HRUs, climate preparation and two continuous
simulations are also complete for a modelled area of approximately
161.95 km² divided into 17 subbasins.
The current engineering focus links the hydrological results with
erosion, sediment deposition and the reassessment of the Hare
diversion headworks.
HARE Spatial Archive
Watershed · terrain · land · drainage · irrigation · models
Published
HARE Watershed · integrated spatial presentation · Team1995
HARE spatial & engineering library
Published Maps, Model Figures & Engineering Visuals
The archive presents each map, hydrological figure and engineering
visualization as an independent technical product. Select any product
once, then use the Previous and Next controls above the large viewer
to browse continuously without returning to the title list. The library now follows the full
HARE Revisited sequence from terrain and irrigation mapping through
HEC-HMS, SWAT hydrology, sediment assessment and field evidence.
Product 01 of 22
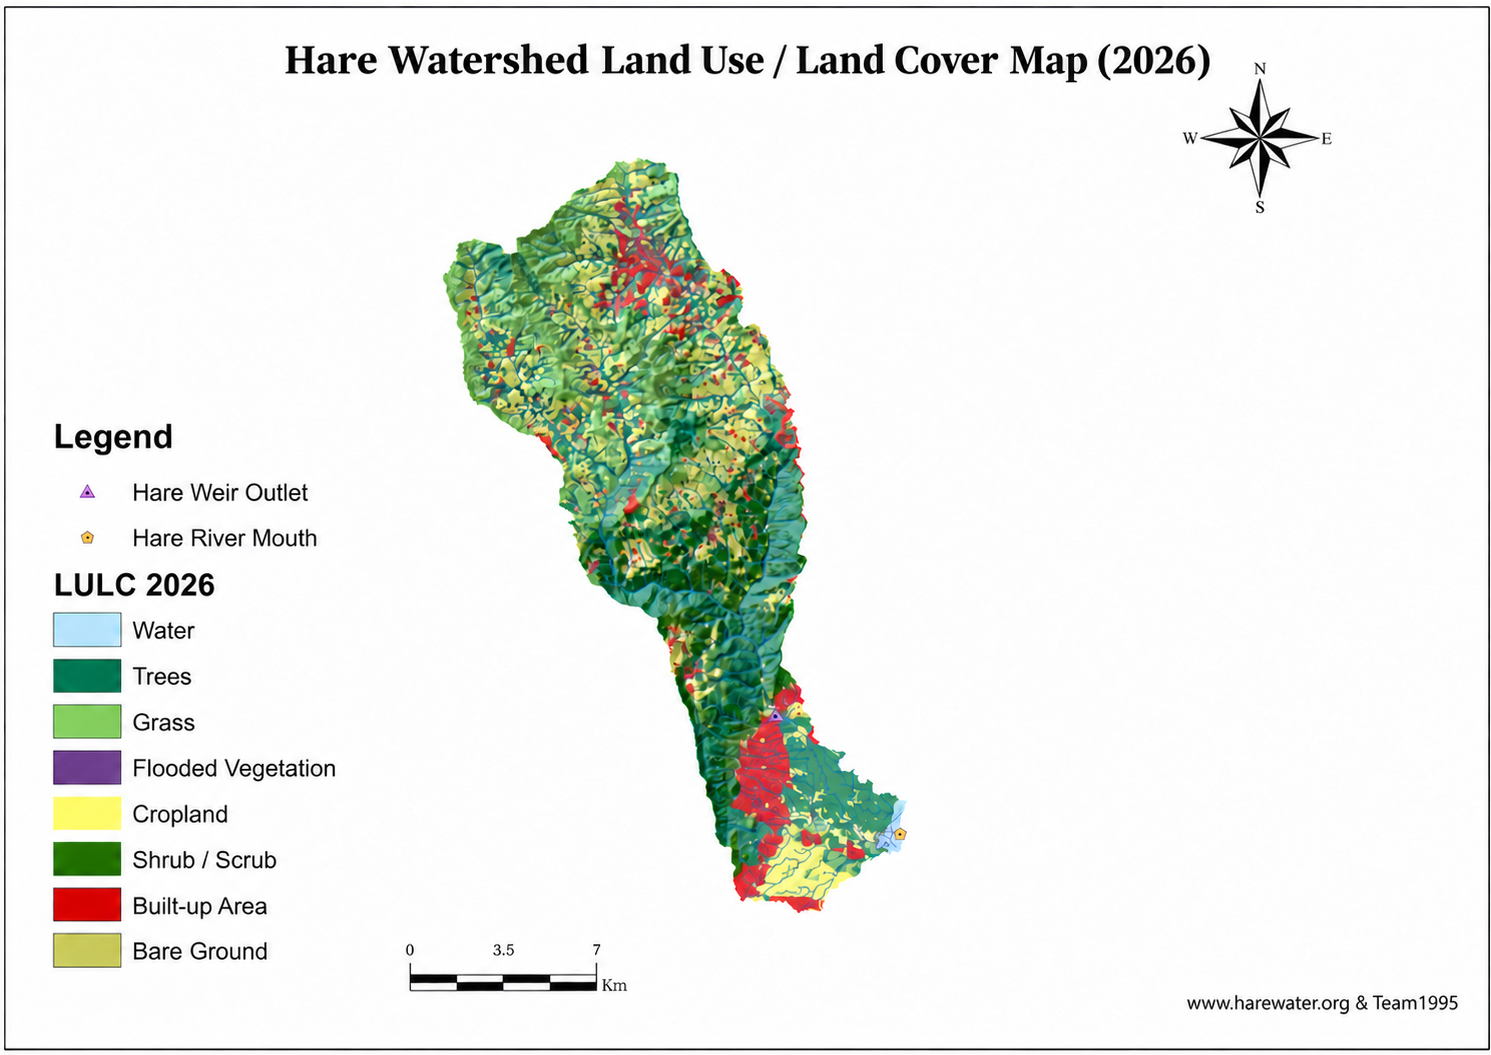
Land Use/Land Cover, Drainage Network and Relief
Browse without returning to the map list
Land Use/Land Cover, Drainage Network and Relief
Integrated GIS map · HARE Revisited · Team1995
Published
Integrated HARE watershed presentation showing land use / land cover over terrain relief, the drainage network, watershed boundary, Hare Weir outlet and Hare River mouth.
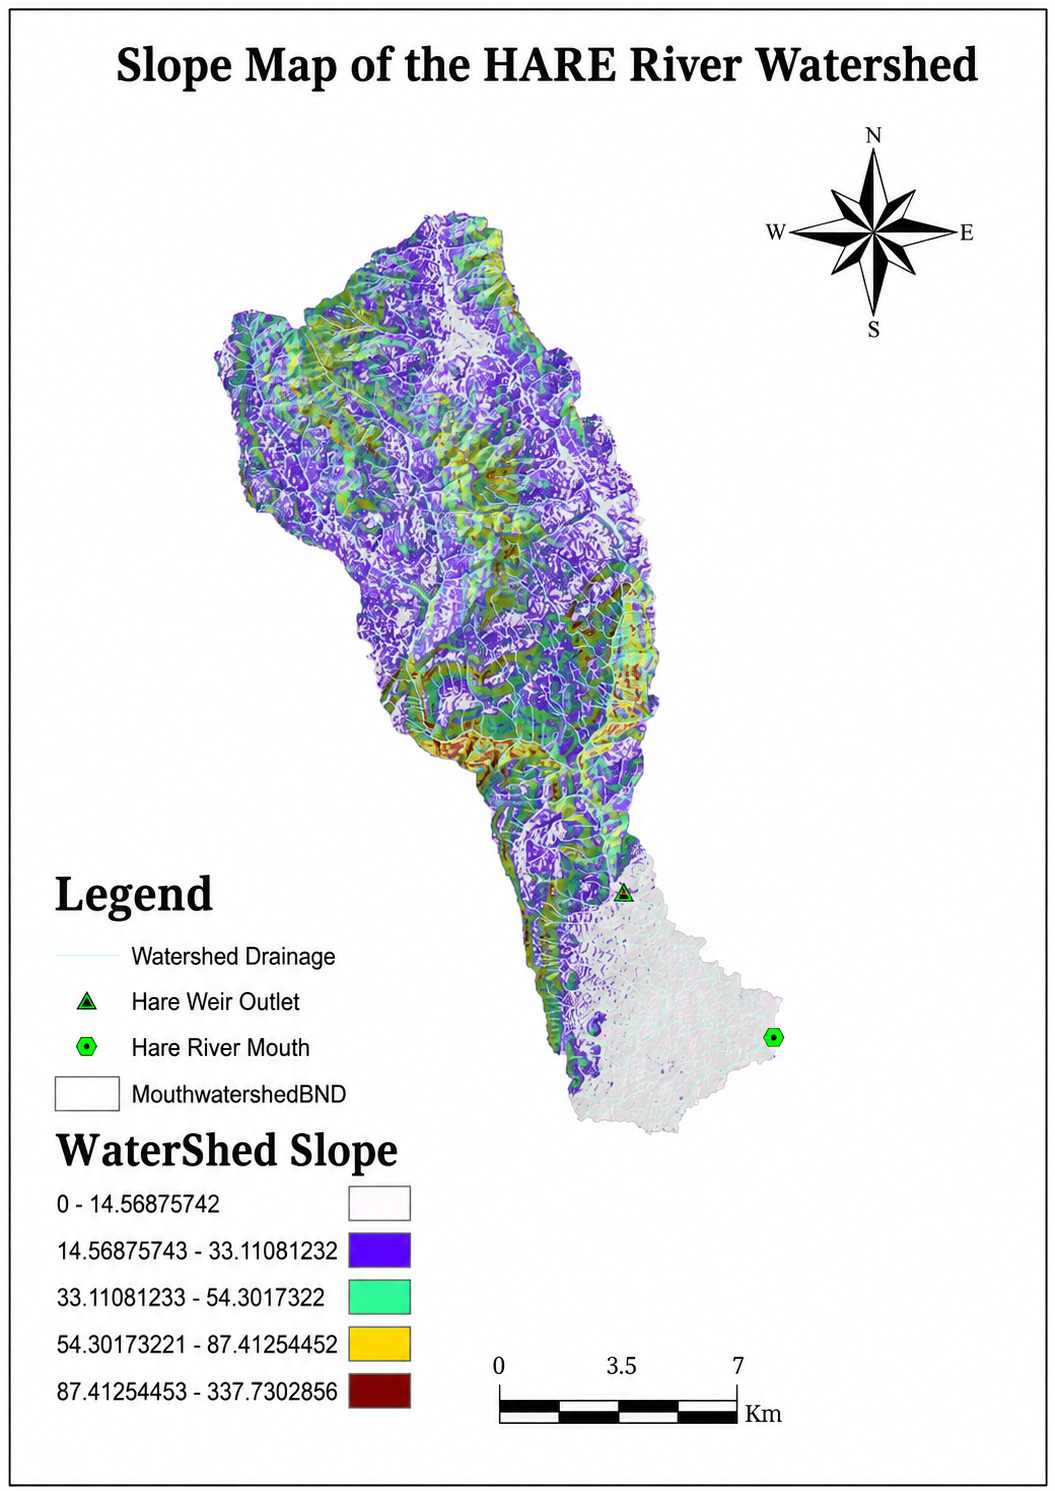
Hare Watershed Slope Map
Terrain analysis · HARE Revisited · Team1995
Published
Slope classification of the Hare Watershed for terrain interpretation and the modern reassessment of runoff, erosion, irrigation suitability and engineering constraints.
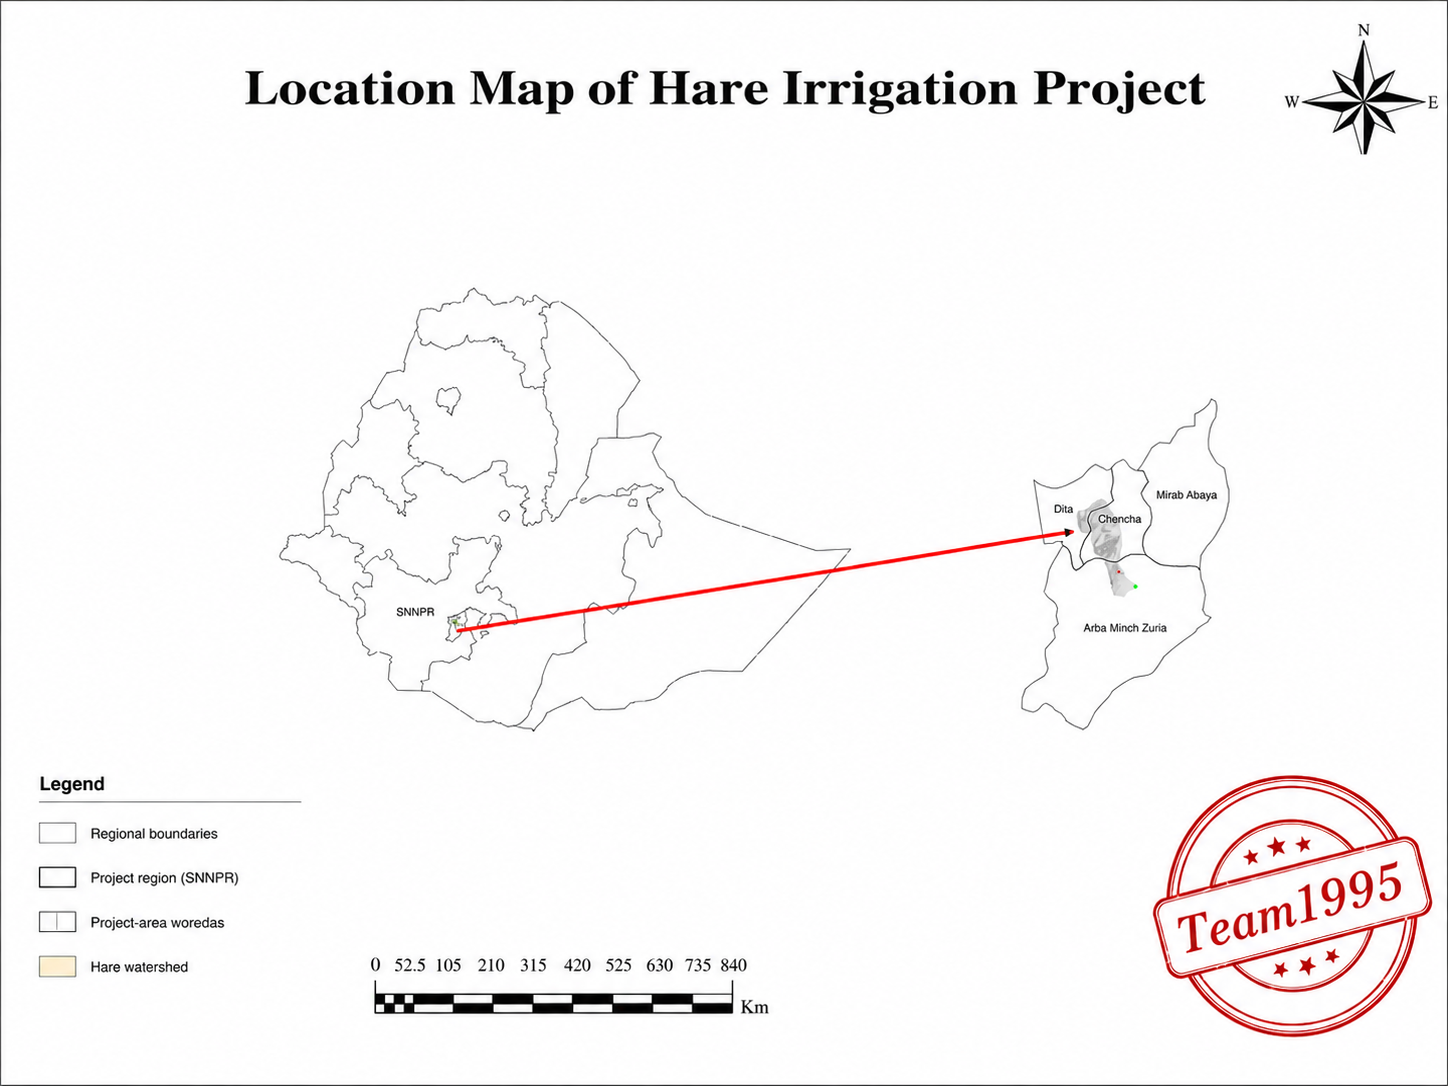
Hare Irrigation Project Location Map
Project location map · HARE Revisited · Team1995
Published
Geographic location of the Hare Irrigation Project within Ethiopia, showing the project region, surrounding project-area woredas and the Hare watershed in an enlarged locator view.
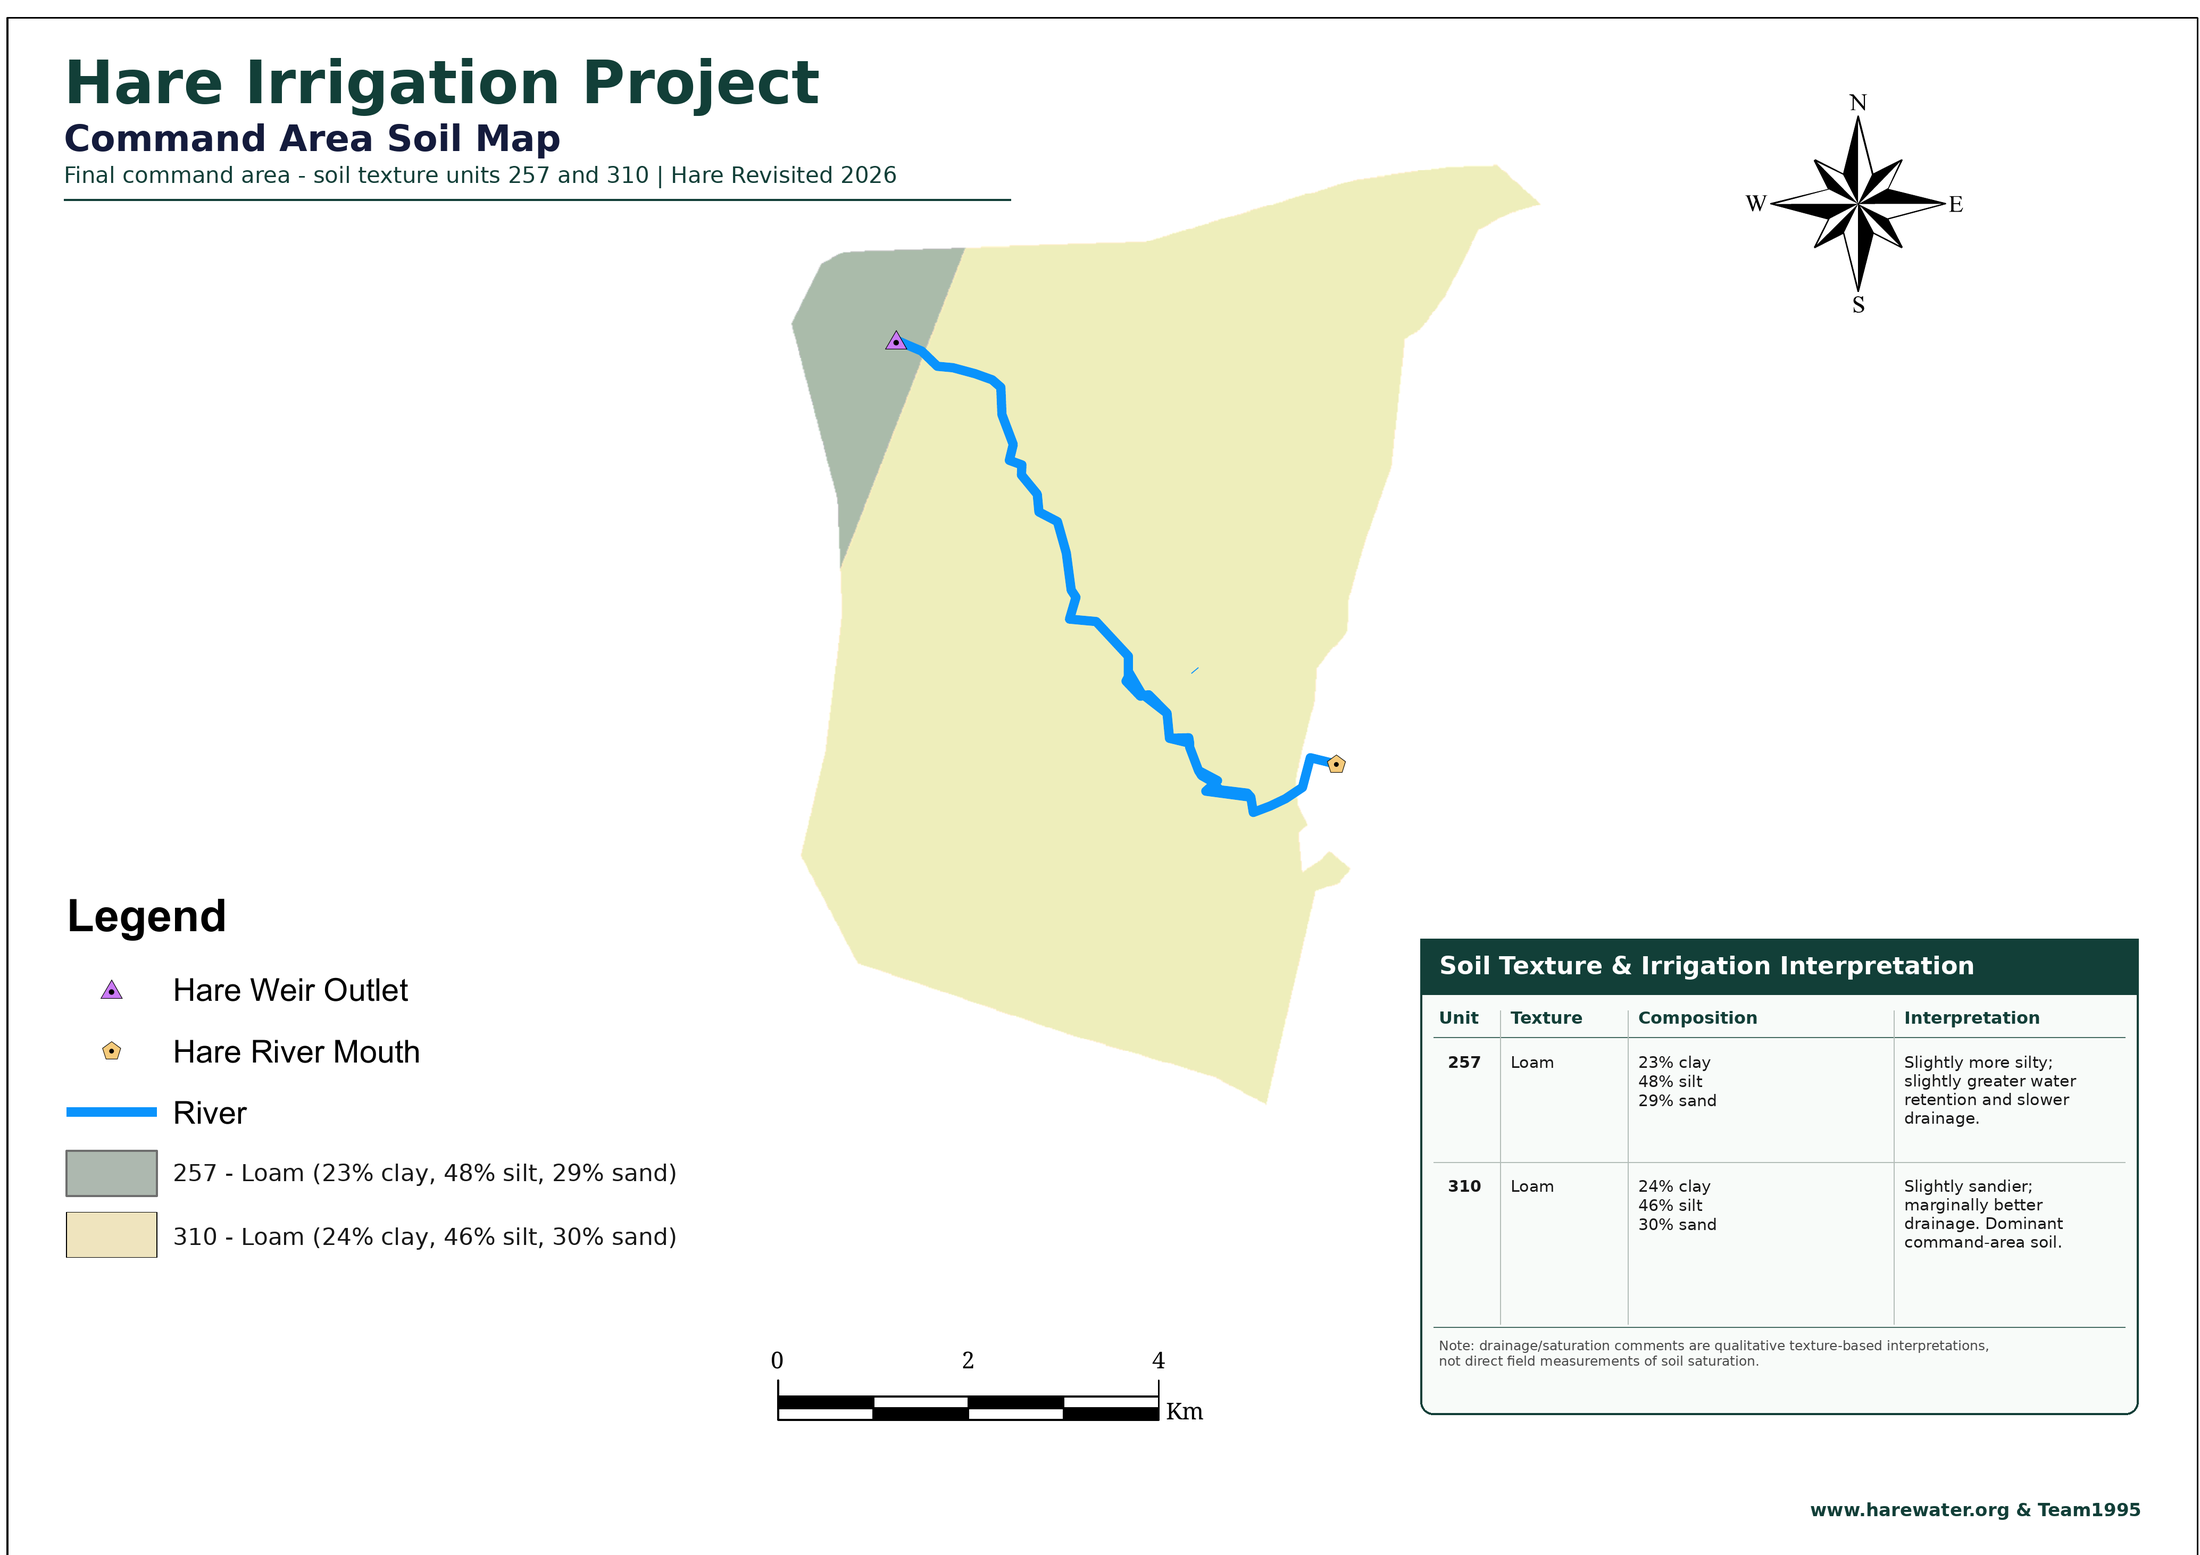
Hare Irrigation Project Soil Map
Soils / land-resource map · HARE Revisited · Team1995
Published
Soil map of the Hare project area showing mapped units 257 and 310. Both are loam soils with relatively small textural differences. The saturation and drainage comparison shown on the figure is a qualitative texture-based interpretation rather than a measured field saturation result.
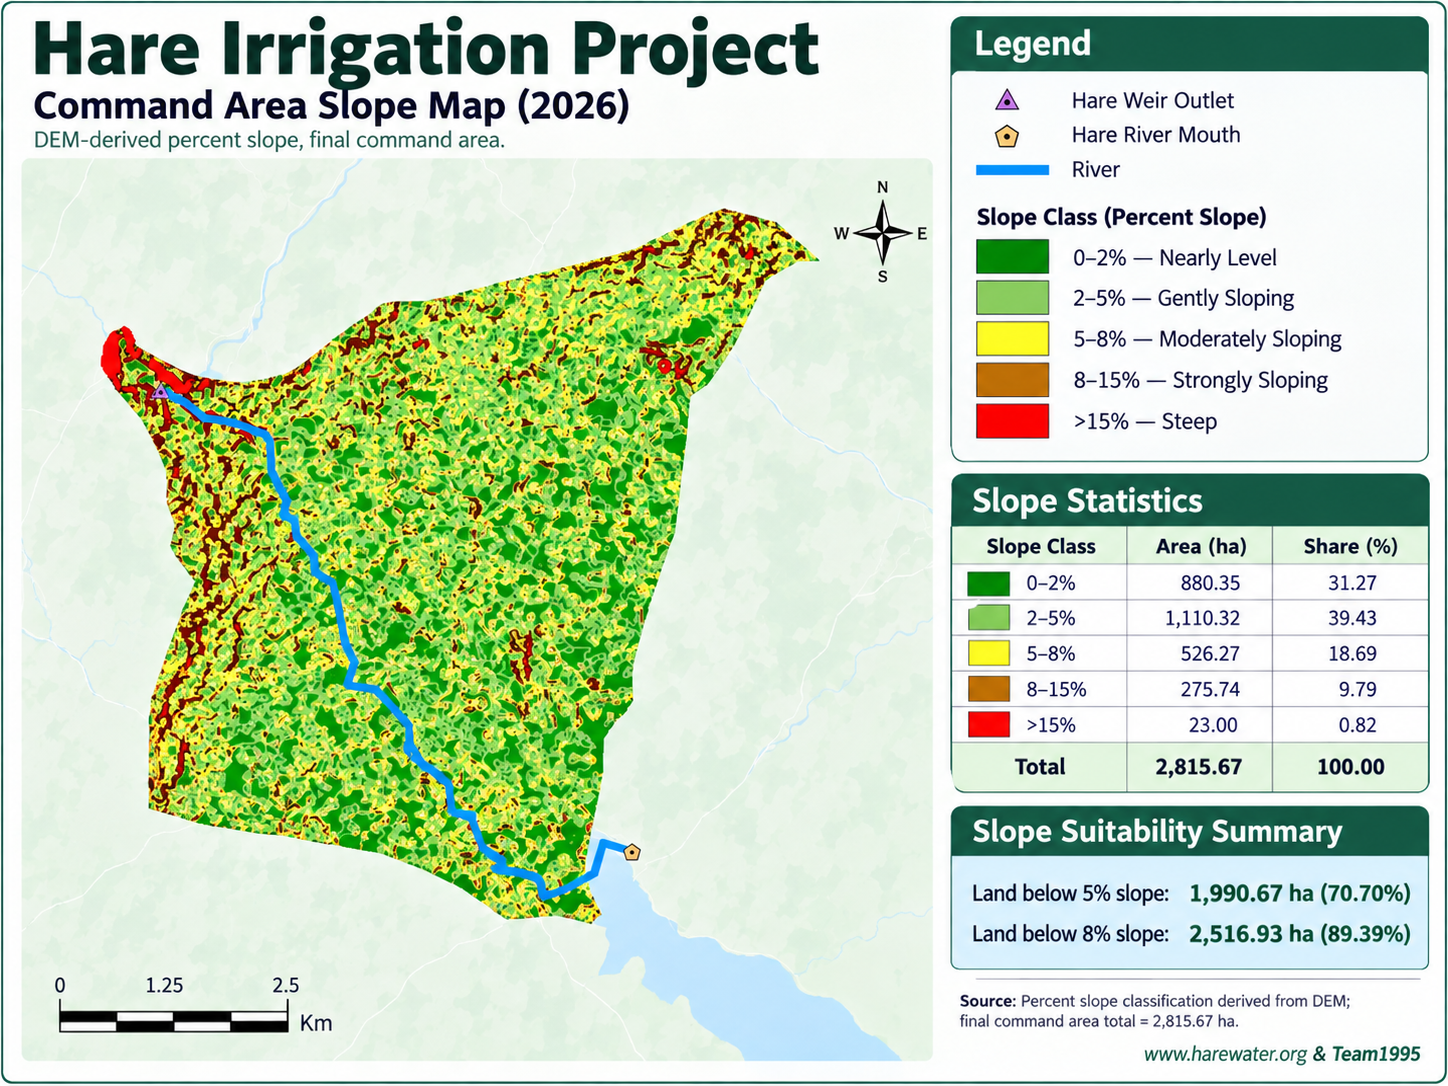
Hare Irrigation Project Command-Area Slope Map
Command-area terrain analysis · HARE Revisited · Team1995
Published
Slope distribution prepared for an earlier reconstructed command-area delineation. The present command-area interpretation subsequently evolved through additional GIS, satellite and canal-layout work. The figure remains part of the archive and is useful for terrain interpretation and canal-alignment review.
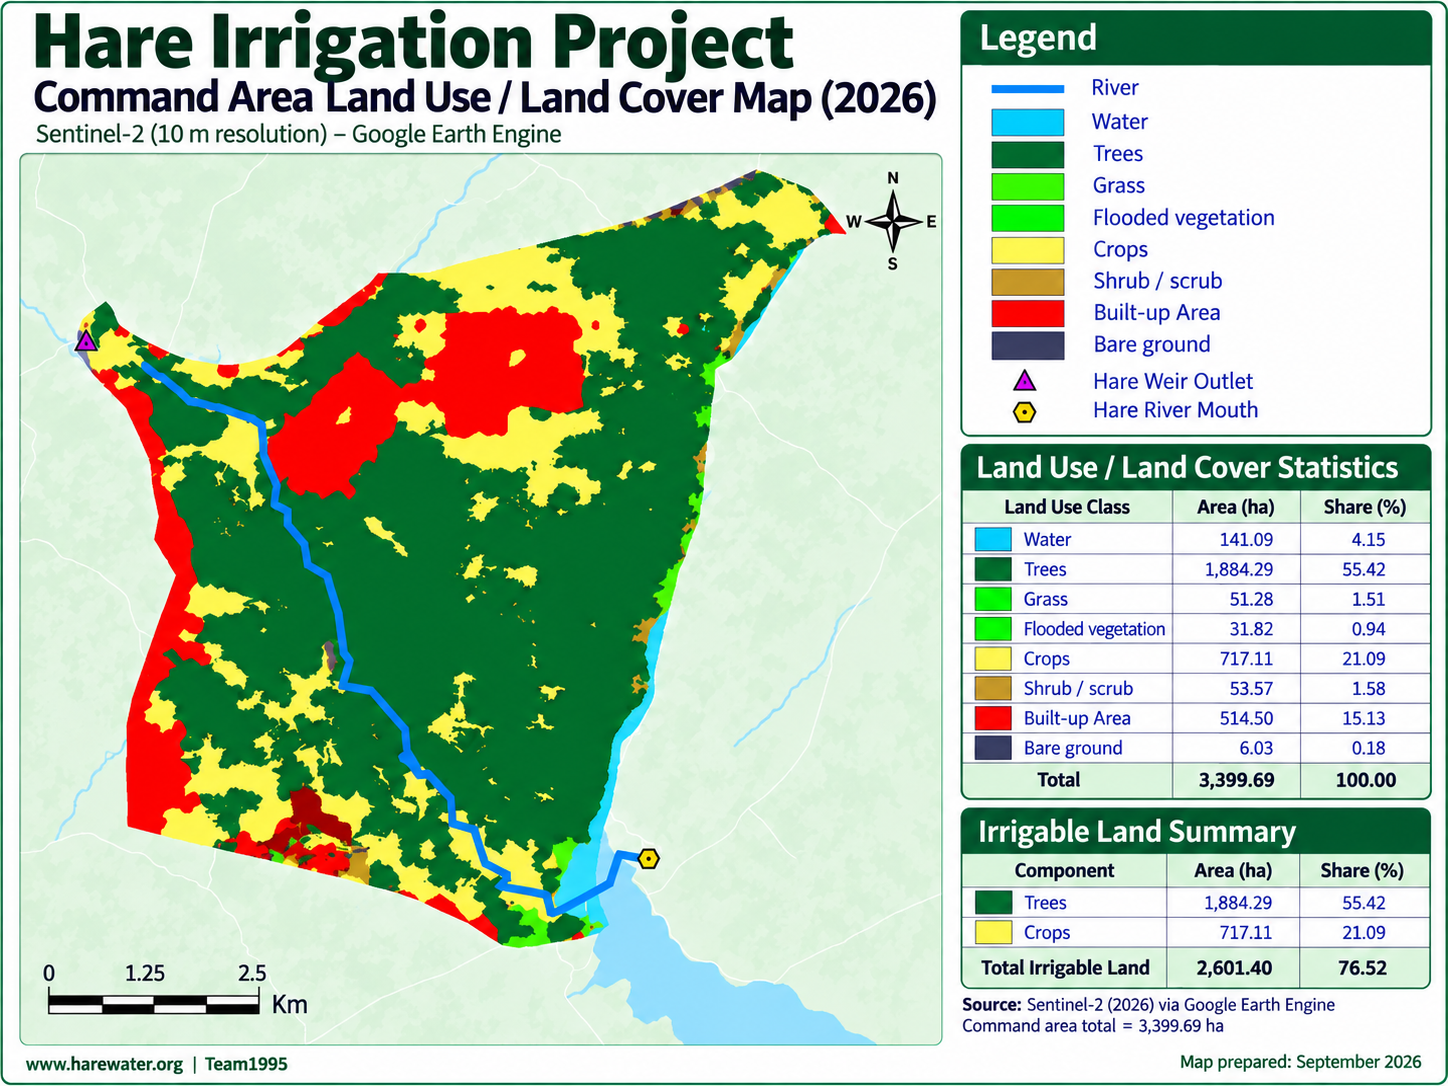
Hare Irrigation Project Command-Area Land Use/Land Cover and Terrain Relief
Command-area land-resource map · HARE Revisited · Team1995
Published
Land-use and land-cover distribution within the reconstructed HARE command area, presented over terrain relief to show the spatial relationship between crops, trees, built areas, rangeland, water features, drainage and topography.
Hare Irrigation Project Command Area and Canal System
Command-area canal-system map · HARE Revisited · Team1995
Published
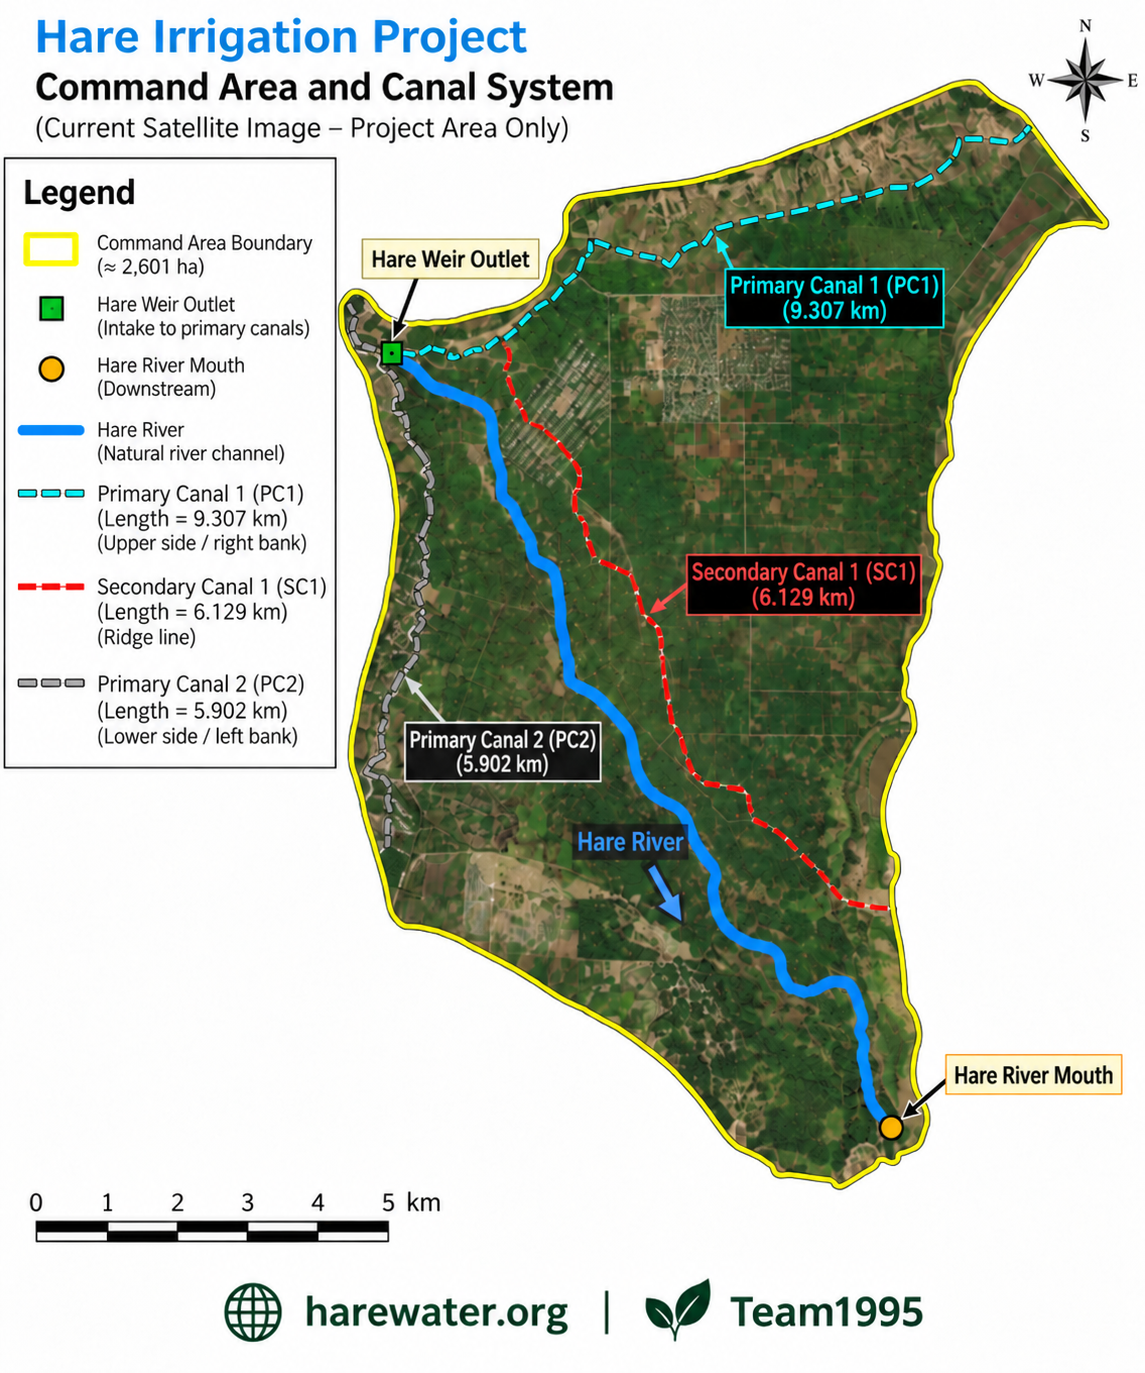
Satellite-background presentation of the reconstructed HARE command area and principal conveyance network. The map identifies Primary Canal 1, Primary Canal 2, Secondary Canal 1 along the ridge, the Hare River, Hare Weir outlet and Hare River mouth. It forms part of the 2026 reconstruction of the irrigation system as it exists and can be interpreted from present spatial evidence.
Hare Irrigation Project Monthly Rainfall Comparison, 1981–1990
Rainfall comparison figure · HARE Revisited · Team1995
Published
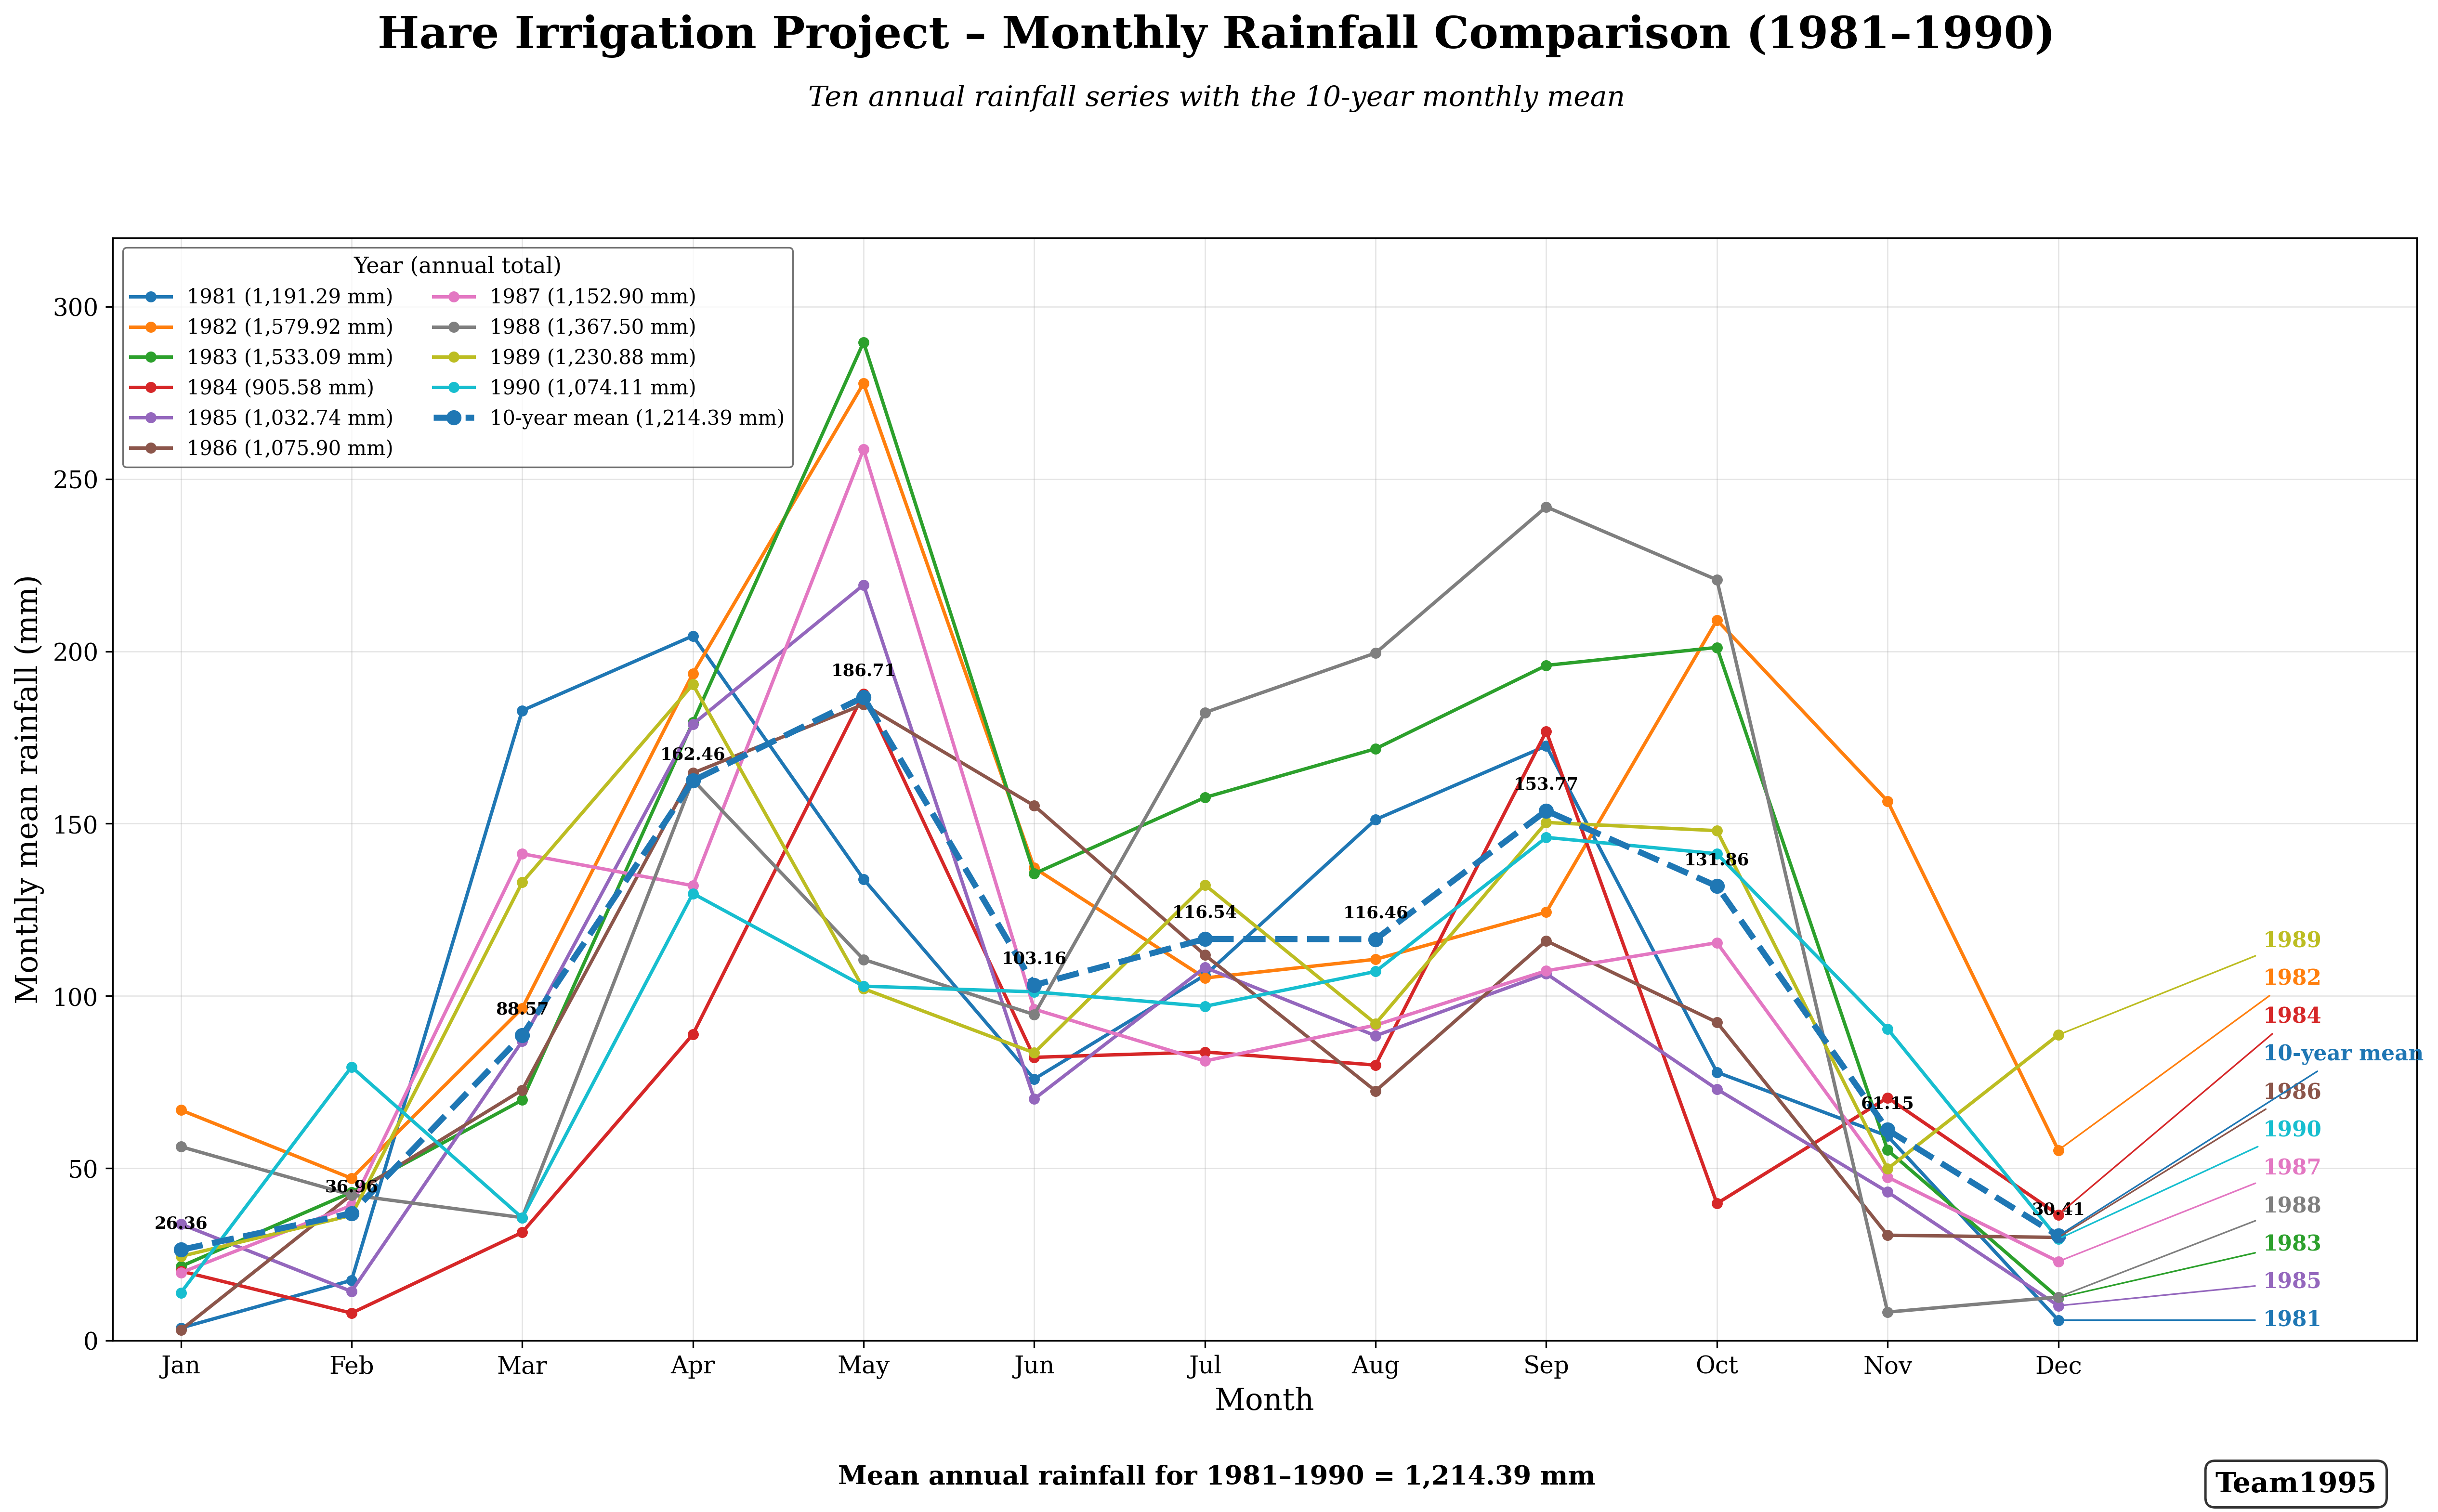
Monthly rainfall comparison for the Hare Irrigation Project over the 1981–1990 analysis period, showing seasonal and interannual rainfall variability used in the HARE Revisited hydrological reassessment.
Hare Irrigation Project 1-in-5 Dry-Year Rainfall, 1981–1990
Design rainfall figure · HARE Revisited · Team1995
Published
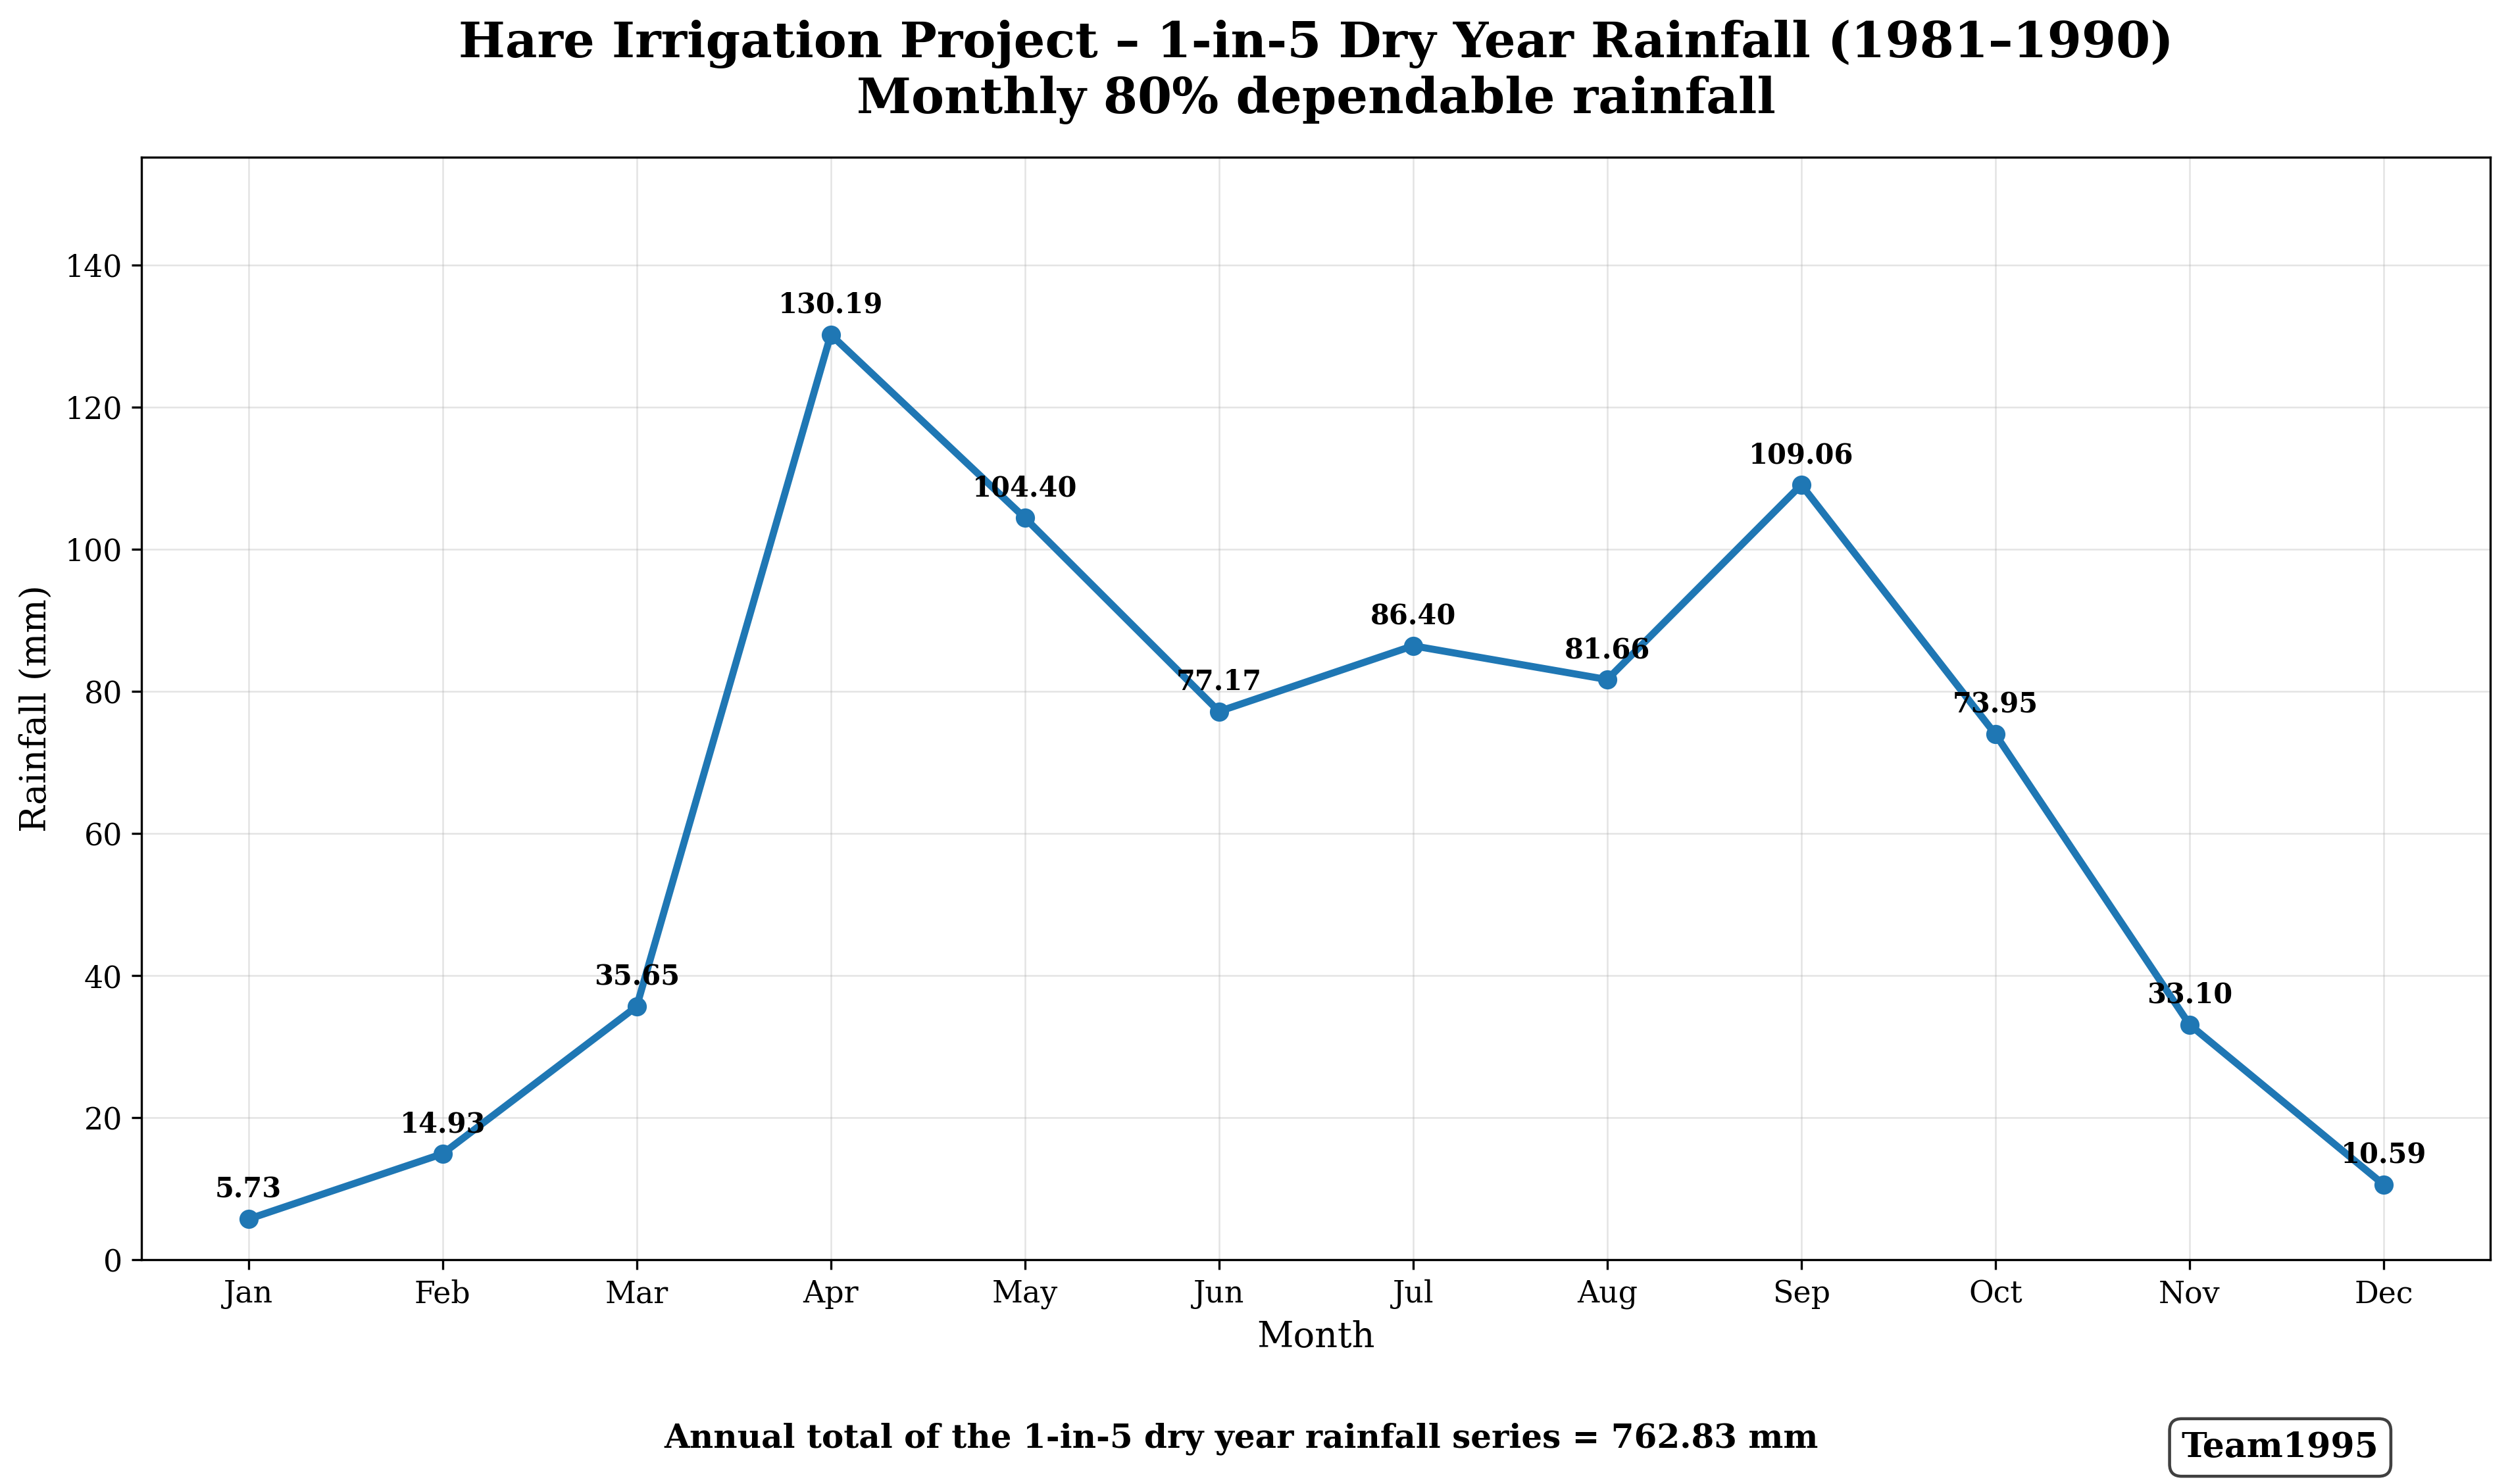
Derived 1-in-5 dry-year rainfall for the 1981–1990 period, prepared to support dependable-rainfall interpretation and irrigation-water planning for HARE Revisited.
PC1 Longitudinal Profile and Drop Structures
Canal longitudinal profile / hydraulic design · HARE Revisited · Team1995
Published
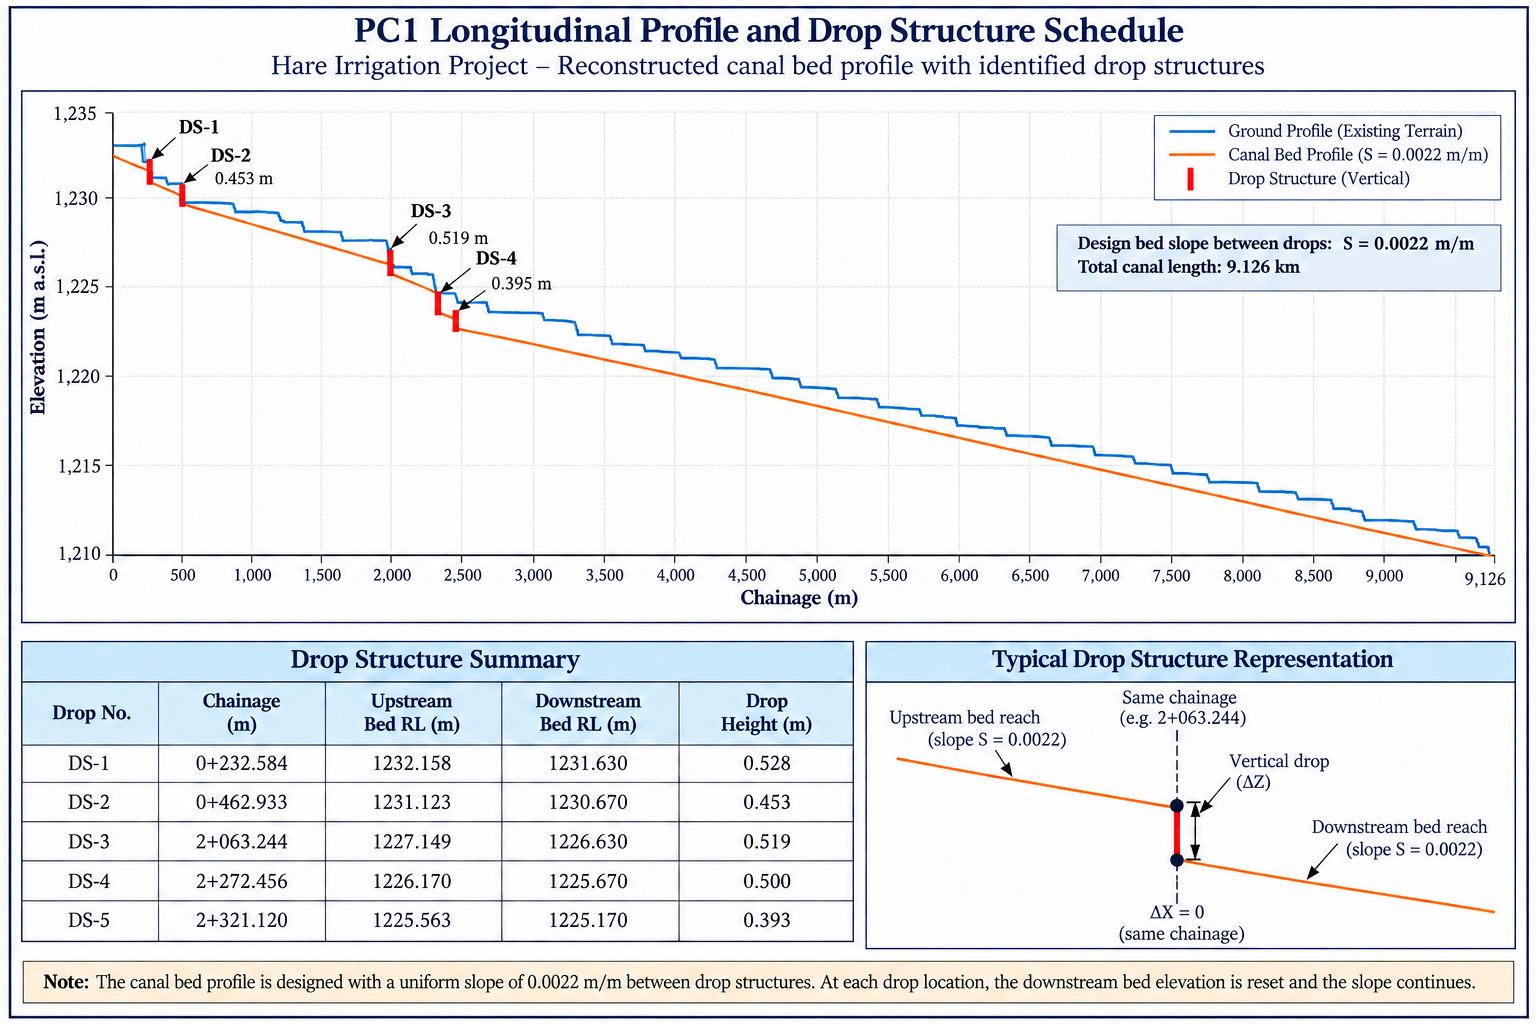
Reconstructed longitudinal profile of Primary Canal 1, showing the natural ground profile, canal-bed interpretation and identified drop structures along the alignment developed during the 2026 hydraulic reassessment.
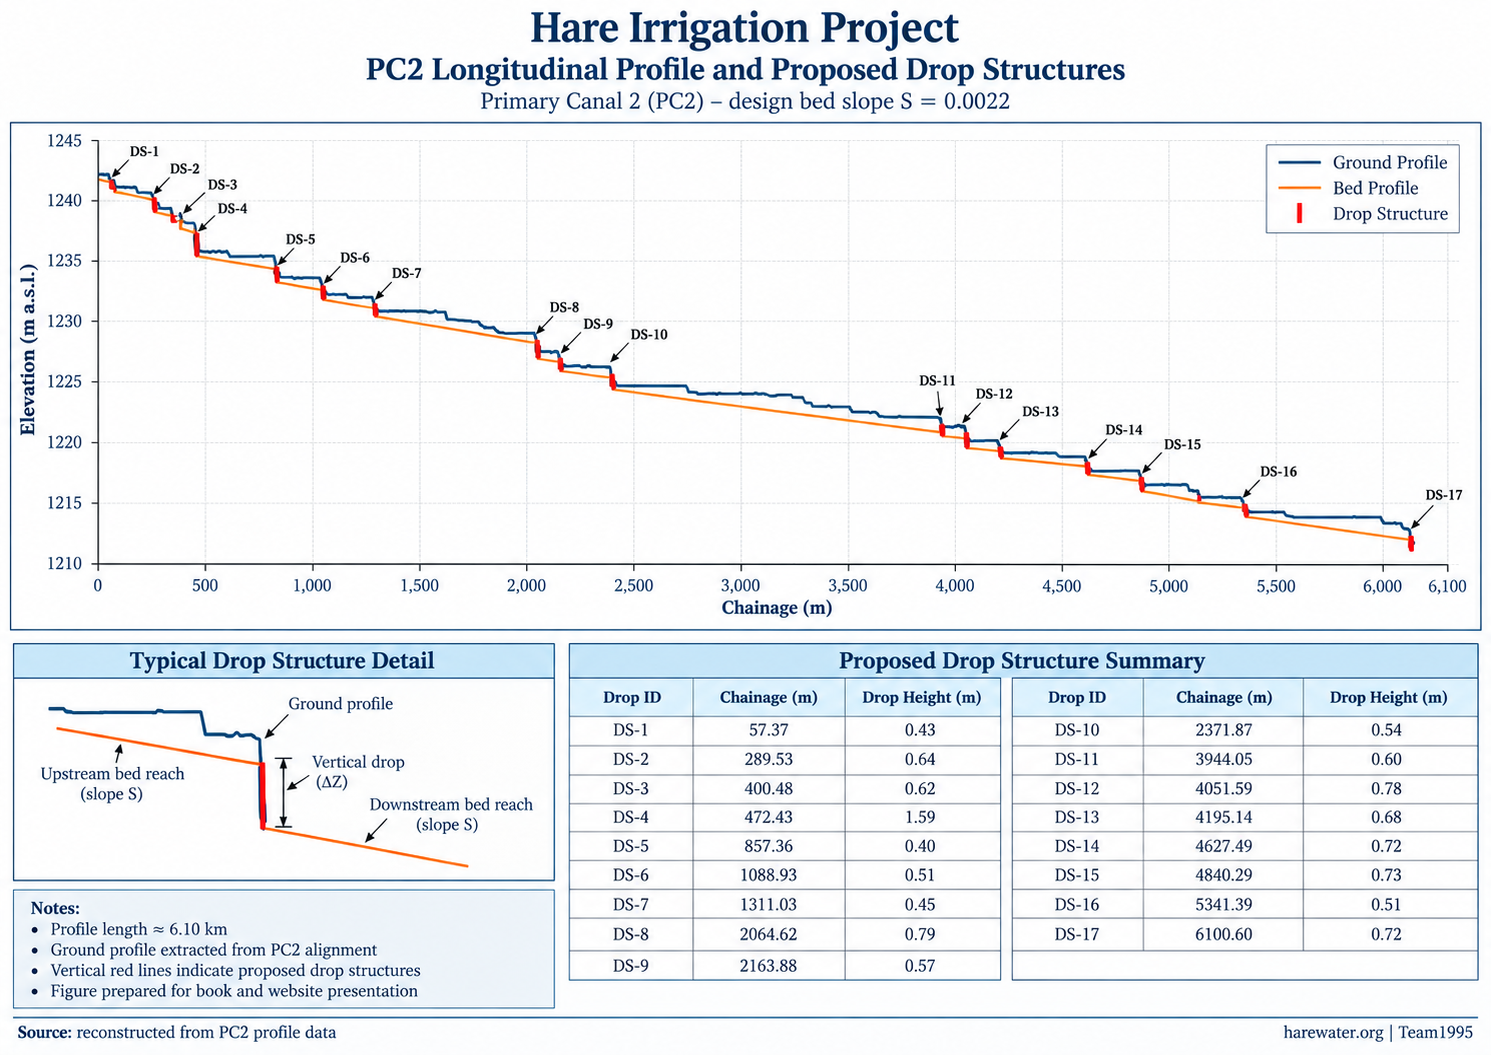
PC2 Longitudinal Profile and Drop Structures
Canal longitudinal profile / hydraulic design · HARE Revisited · Team1995
Published
Reconstructed longitudinal profile of Primary Canal 2, showing the natural ground profile, canal-bed interpretation and identified drop structures during the 2026 hydraulic reassessment.
Hare Weir Catchment — HEC-HMS Subbasins, Land Use and SCS Curve Number Analysis
HEC-HMS catchment / SCS Curve Number analysis · HARE Revisited · Team1995
Published
HEC-HMS catchment analysis for the Hare Weir showing five modelled subbasins, mapped land use and weighted SCS Curve Numbers. The HEC-HMS catchment area is 162.035 km². Hydrologic Soil Group C is used and the weighted subbasin Curve Numbers range from 74.62 to 78.94.
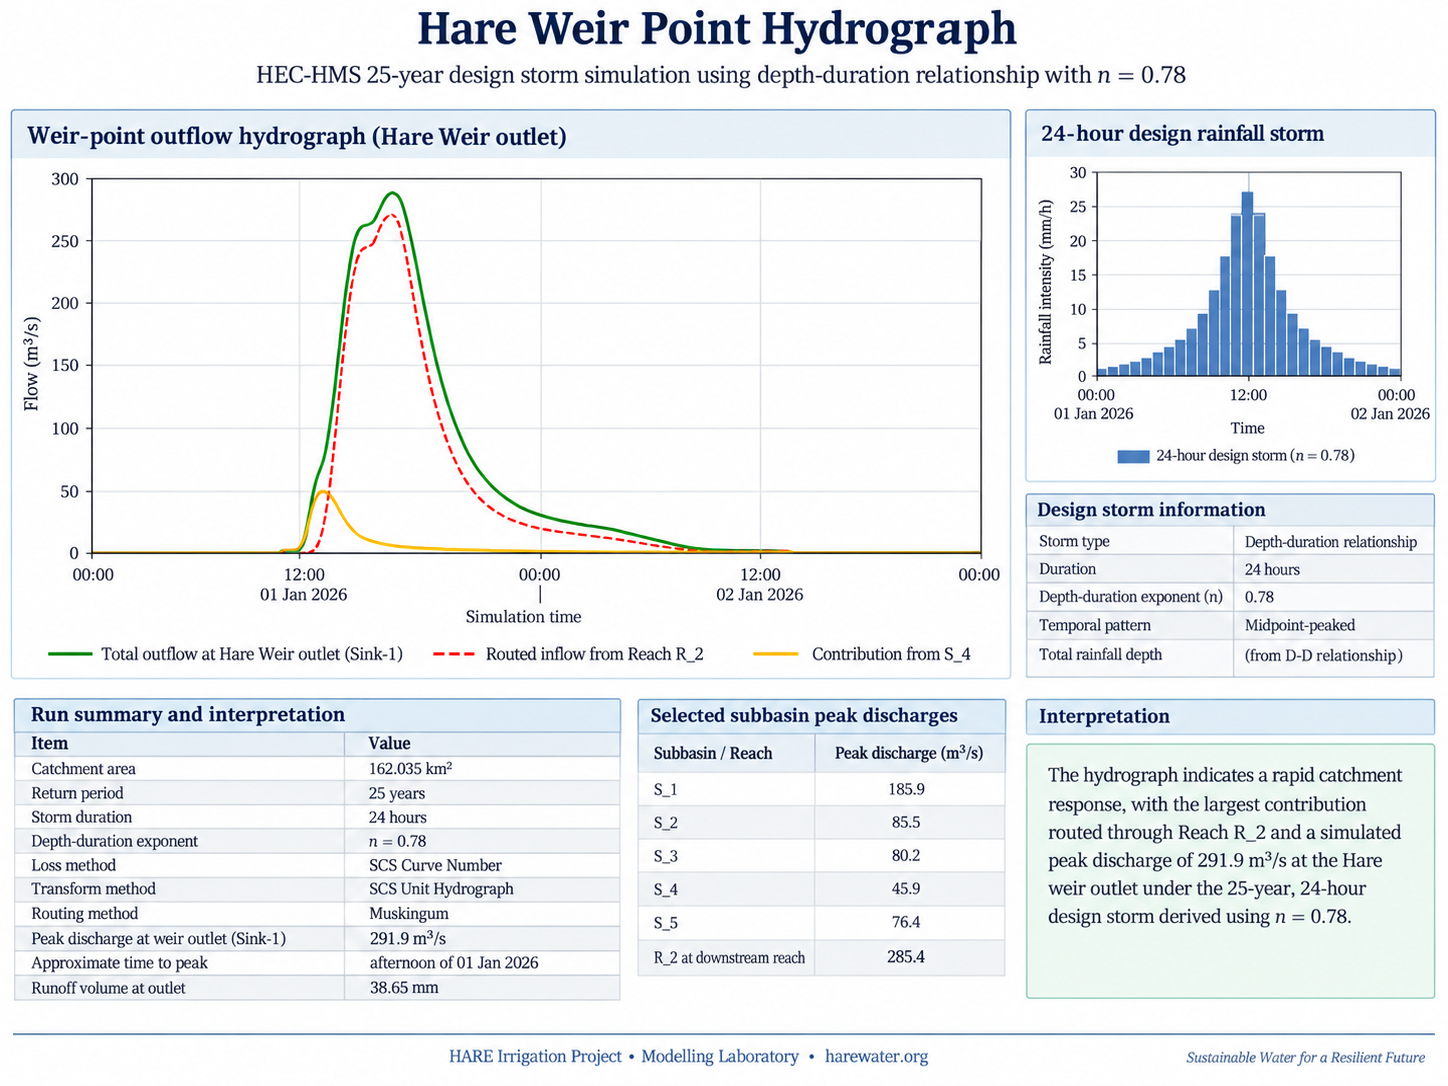
Archived HEC-HMS 25-Year Sensitivity Case (n = 0.78)
Archived HEC-HMS sensitivity case · HARE Revisited · Team1995
Published
Archived sensitivity case from an earlier stage of the HEC-HMS reassessment. It is retained to document the evolution of the analysis and is not the accepted HEC-HMS reference design result. The accepted reference is the completed 50-year simulation with a peak discharge of 114.4 m³/s at Sink-1 / Hare Weir.
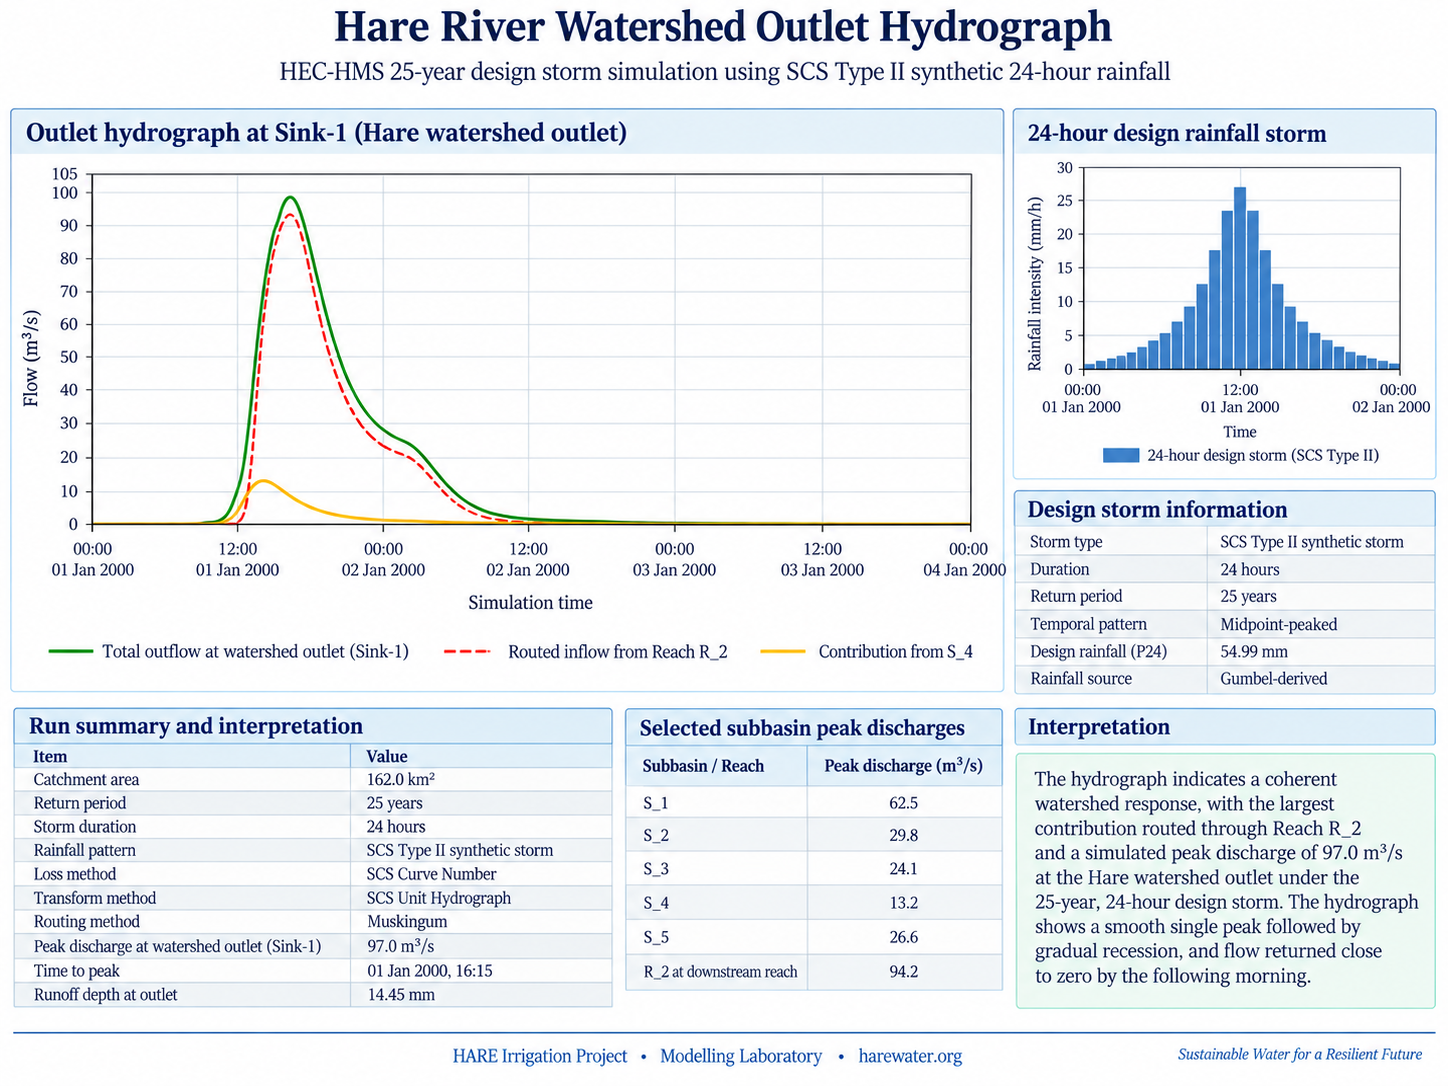
Archived HEC-HMS 25-Year Comparison Run
Archived HEC-HMS comparison run · HARE Revisited · Team1995
Published
Earlier HEC-HMS 25-year simulation retained as part of the technical archive. It documents an intermediate comparison run and should not be read as the present accepted design reference.
Hare River Watershed Outlet Hydrograph — Accepted HEC-HMS 50-Year Result
Accepted HEC-HMS 50-year design-flood result · HARE Revisited · Team1995
Published
Accepted HEC-HMS reference simulation for the 162.035 km² Hare Weir catchment. The adopted 50-year, 24-hour design rainfall is 58.98 mm. Using SCS Curve Number loss, SCS Unit Hydrograph transformation and Muskingum routing, the model produces a peak discharge of 114.4 m³/s at Sink-1 / Hare Weir. The reported runoff depth is 16.84 mm, equivalent to approximately 2.73 million m³ of simulated direct storm runoff.
Existing Hare Diversion Weir — Preliminary Hydraulic Capacity Assessment
Existing weir / preliminary hydraulic-capacity assessment · HARE Revisited · Team1995
Published
Preliminary hydraulic-capacity assessment of the existing Hare diversion weir based on the constructed structure and photographic interpretation. Using the measured crest length, an adopted flood head and representative ogee coefficient, the indicative back-calculated capacity is approximately 162 m³/s. This is a preliminary engineering estimate and is not presented as the documented original design discharge.
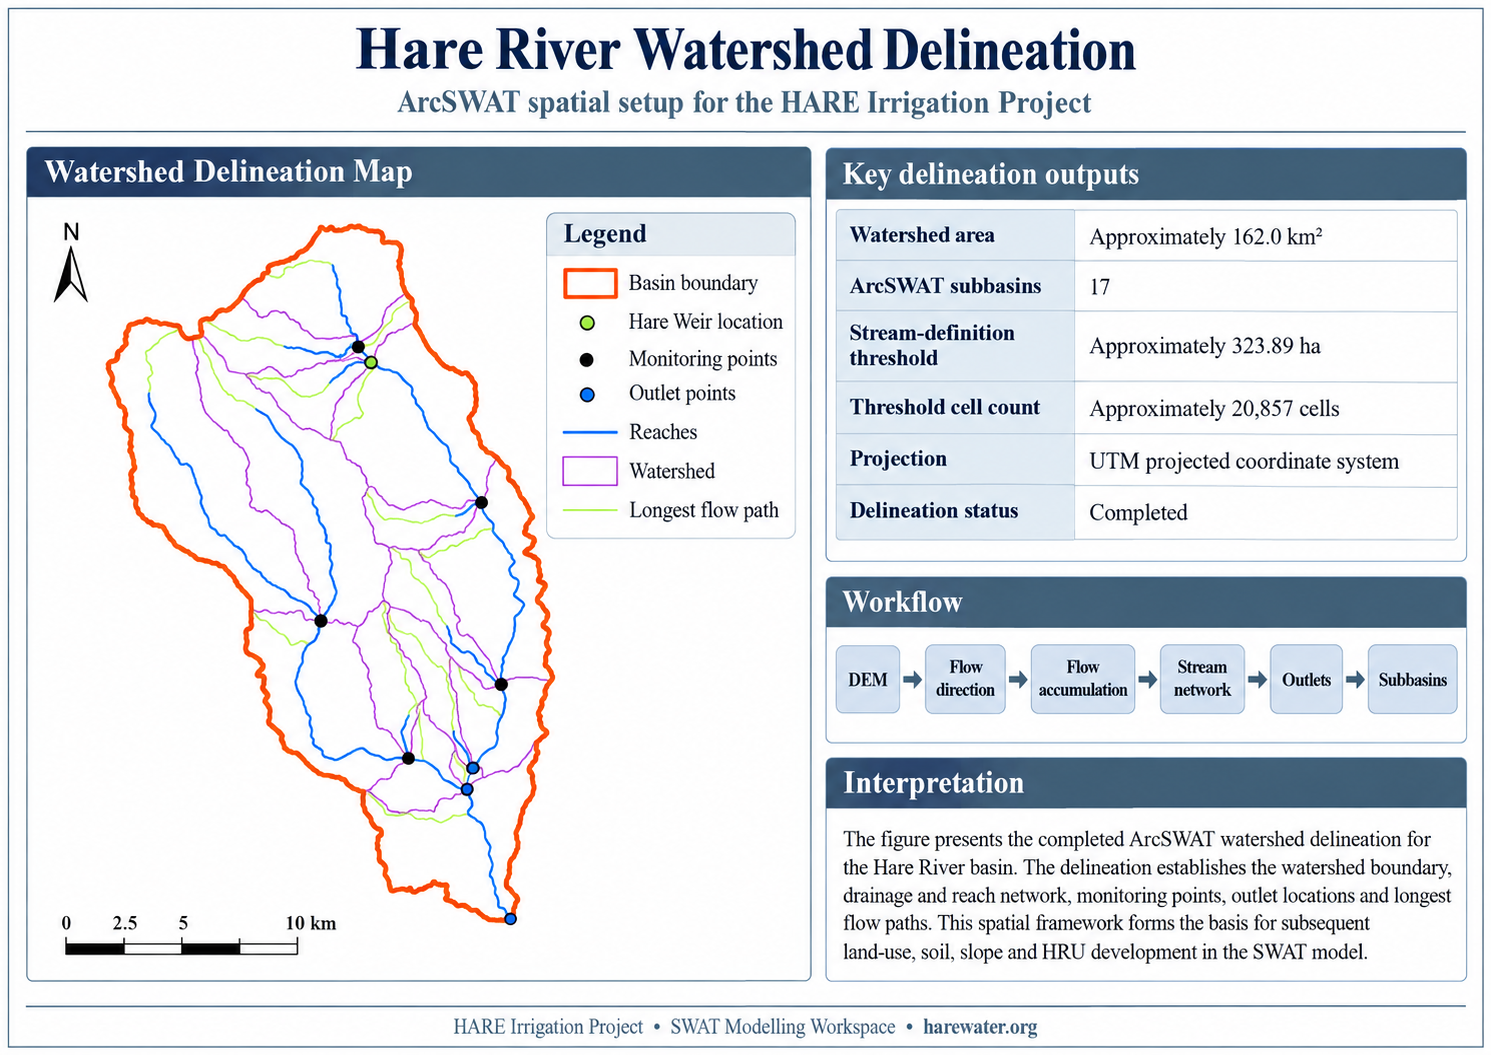
SWAT Watershed Delineation — Hare Weir Catchment
SWAT watershed delineation · HARE Revisited · Team1995
Published
ArcSWAT watershed delineation developed for the modern HARE reassessment. The SWAT model represents approximately 161.95 km² through 17 subbasins and provides the spatial framework for HRU definition, climate forcing, streamflow, erosion and sediment simulation.
SWAT Simulation 2 — Hydrology Summary
SWAT continuous hydrology result · HARE Revisited · Team1995
Published
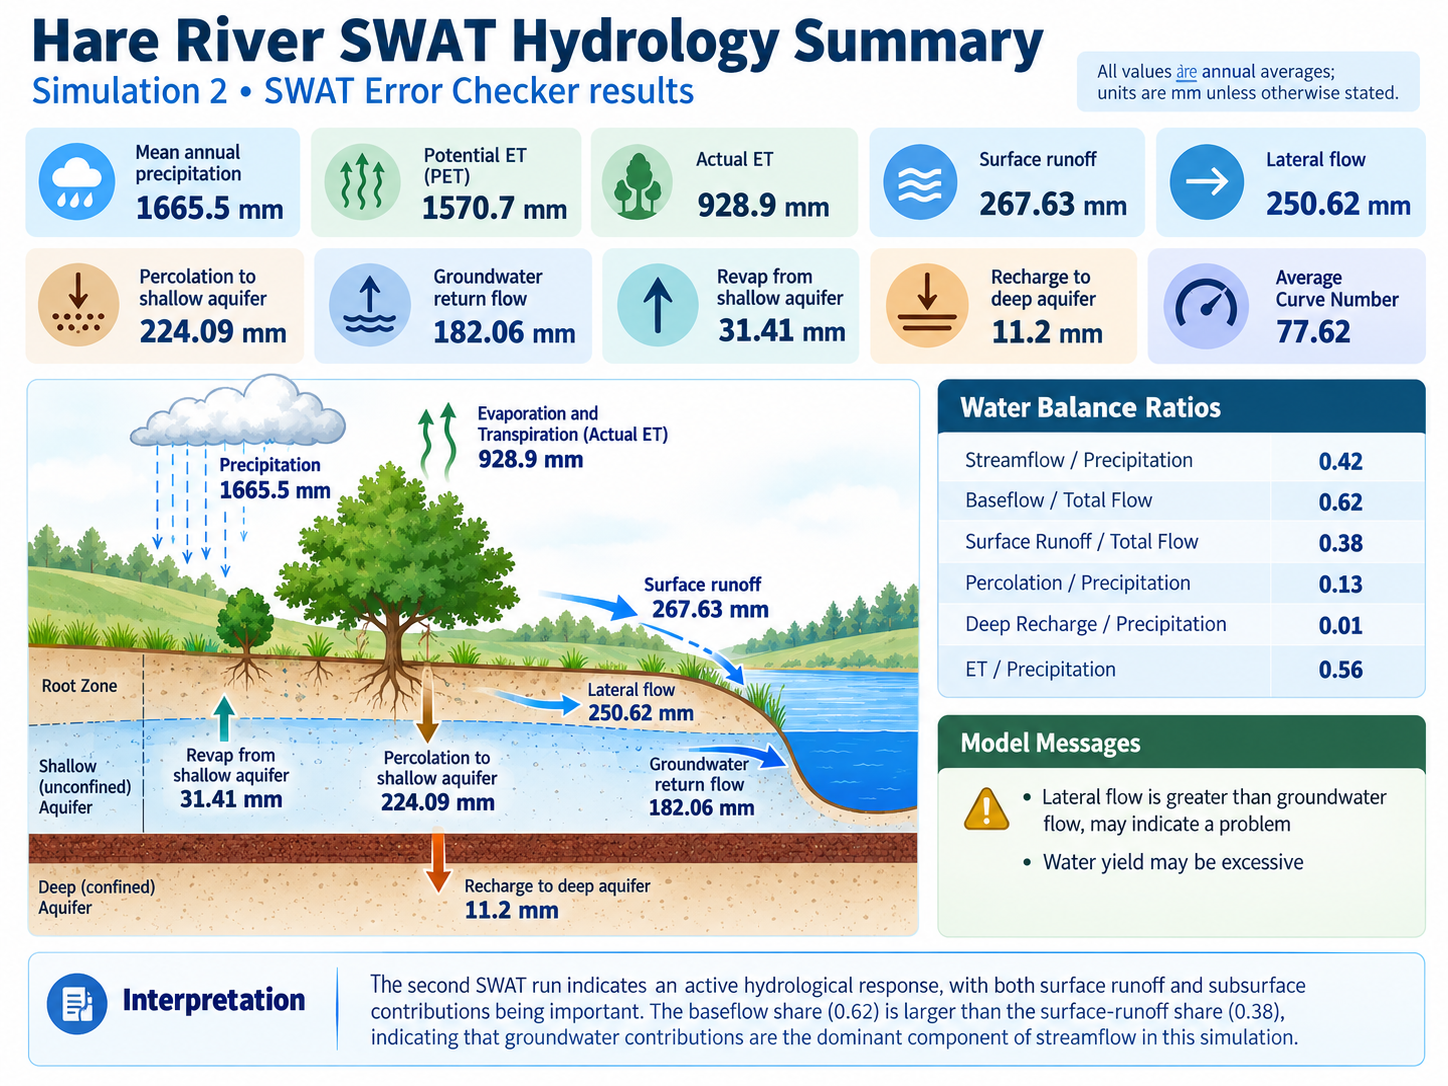
Hydrological summary of SWAT Simulation 2. The continuous model uses the 2020–2025 climate period, with 2020 treated as model warm-up and the later years used for interpretation. Mean annual precipitation is 1665.5 mm, actual evapotranspiration 928.9 mm, surface runoff 267.63 mm and groundwater return flow 182.06 mm. The simulation remains uncalibrated and is interpreted as a current reference model rather than a final calibrated prediction.
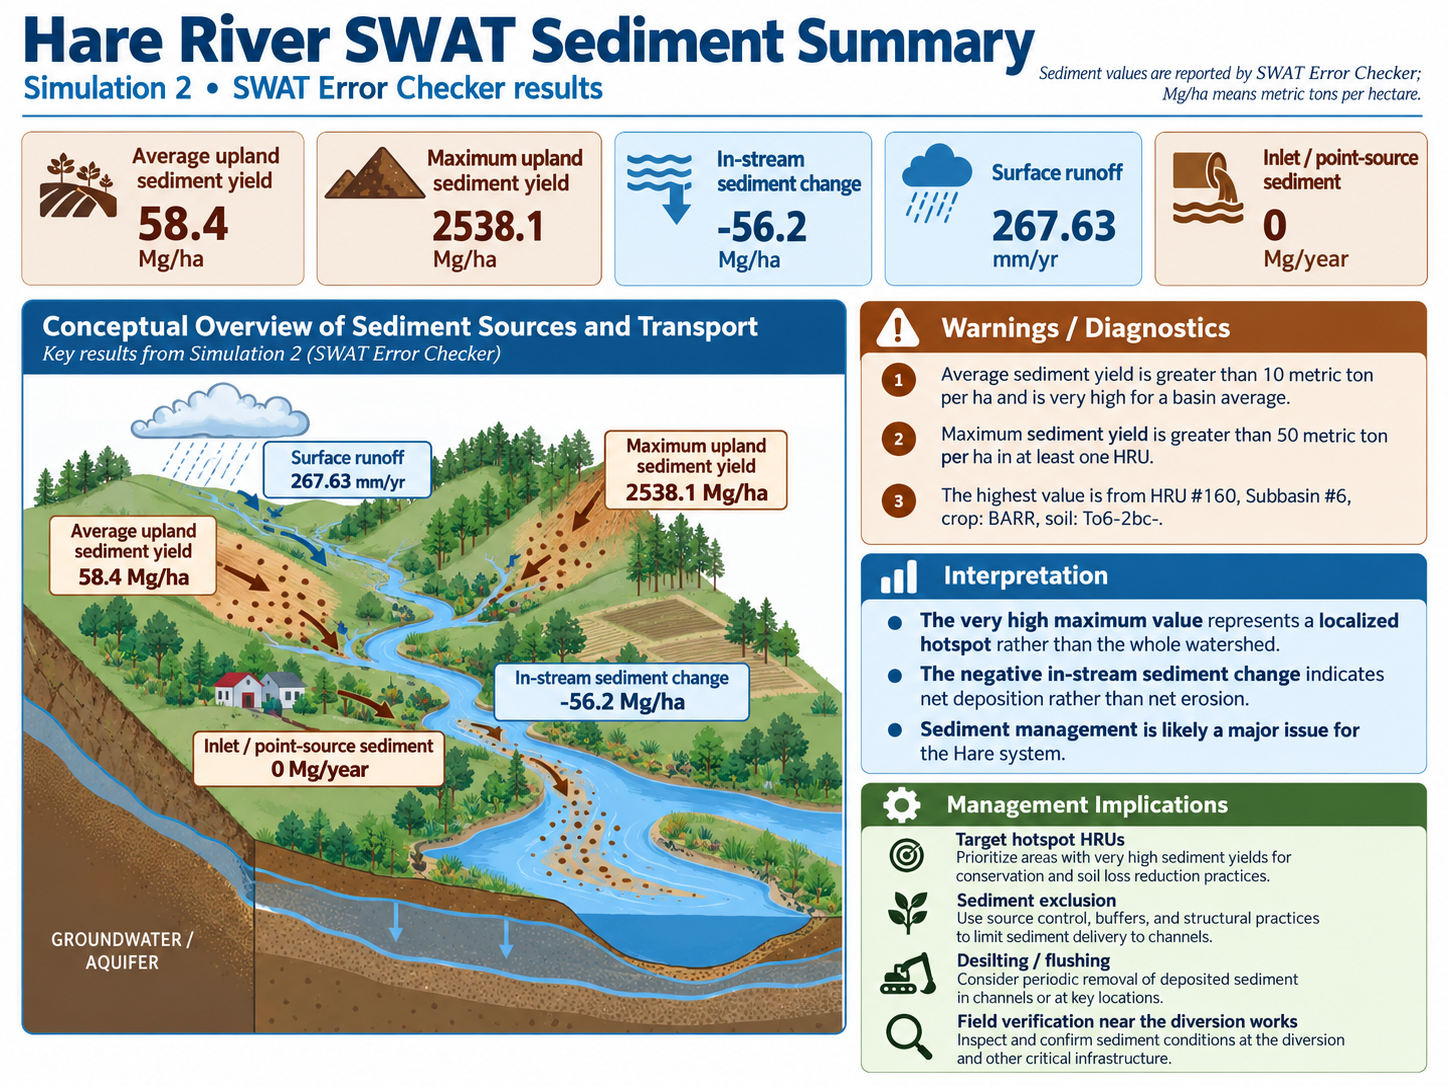
Sediment summary from the current SWAT reference simulation. Average upland sediment yield is approximately 58.4 Mg/ha. The strongest simulated hotspot occurs at HRU 160 in Subbasin 6 under the BARR land-use class. The reported 96.23% channel-deposition diagnostic indicates strong simulated in-stream deposition across the modelled channel system; it should not be interpreted as a measured percentage deposited specifically at the Hare Weir. The sediment model is not yet calibrated.
Field Evidence of Sedimentation at the Hare Diversion
Field sedimentation evidence · HARE Revisited · Team1995
Published
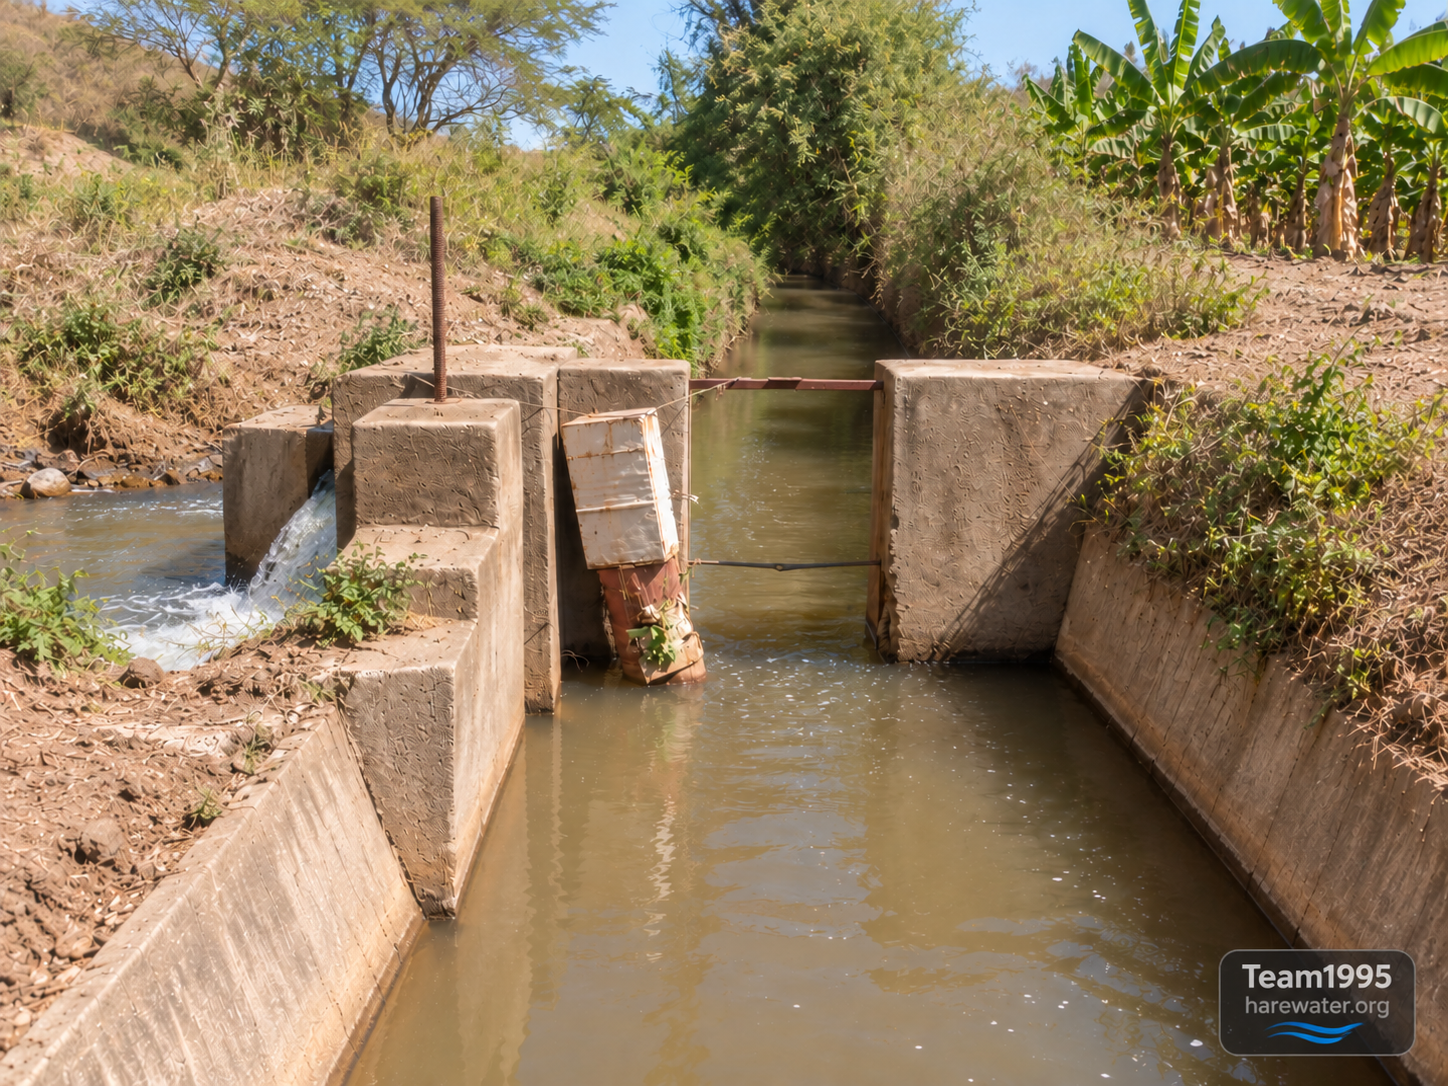
Field evidence documenting substantial coarse and finer sediment accumulation around the present Hare diversion works. The photographs support the need to examine sediment transport, intake alignment, scour and flushing arrangements, sediment exclusion and desilting. No exact sediment depth or deposited volume is inferred from the photographs alone.
Presentation method:
only one large figure is shown at a time. Images are loaded
when selected so the growing technical archive remains readable
and reasonably fast.
Hydraulic structures · HARE Revisited
Reconstructed Weir, Intake & Headworks
These visualizations reconstruct the observed upstream arrangement
of the HARE diversion works from field photographs, video evidence
and surviving structural details. They are interpretive engineering
reconstructions rather than original as-built drawings.
Engineering reconstruction 01
Upstream Intake Structure
Reconstructed upstream interpretation of the intake
arrangement, including the canal intake and the adjacent
controlled return path for excess water.
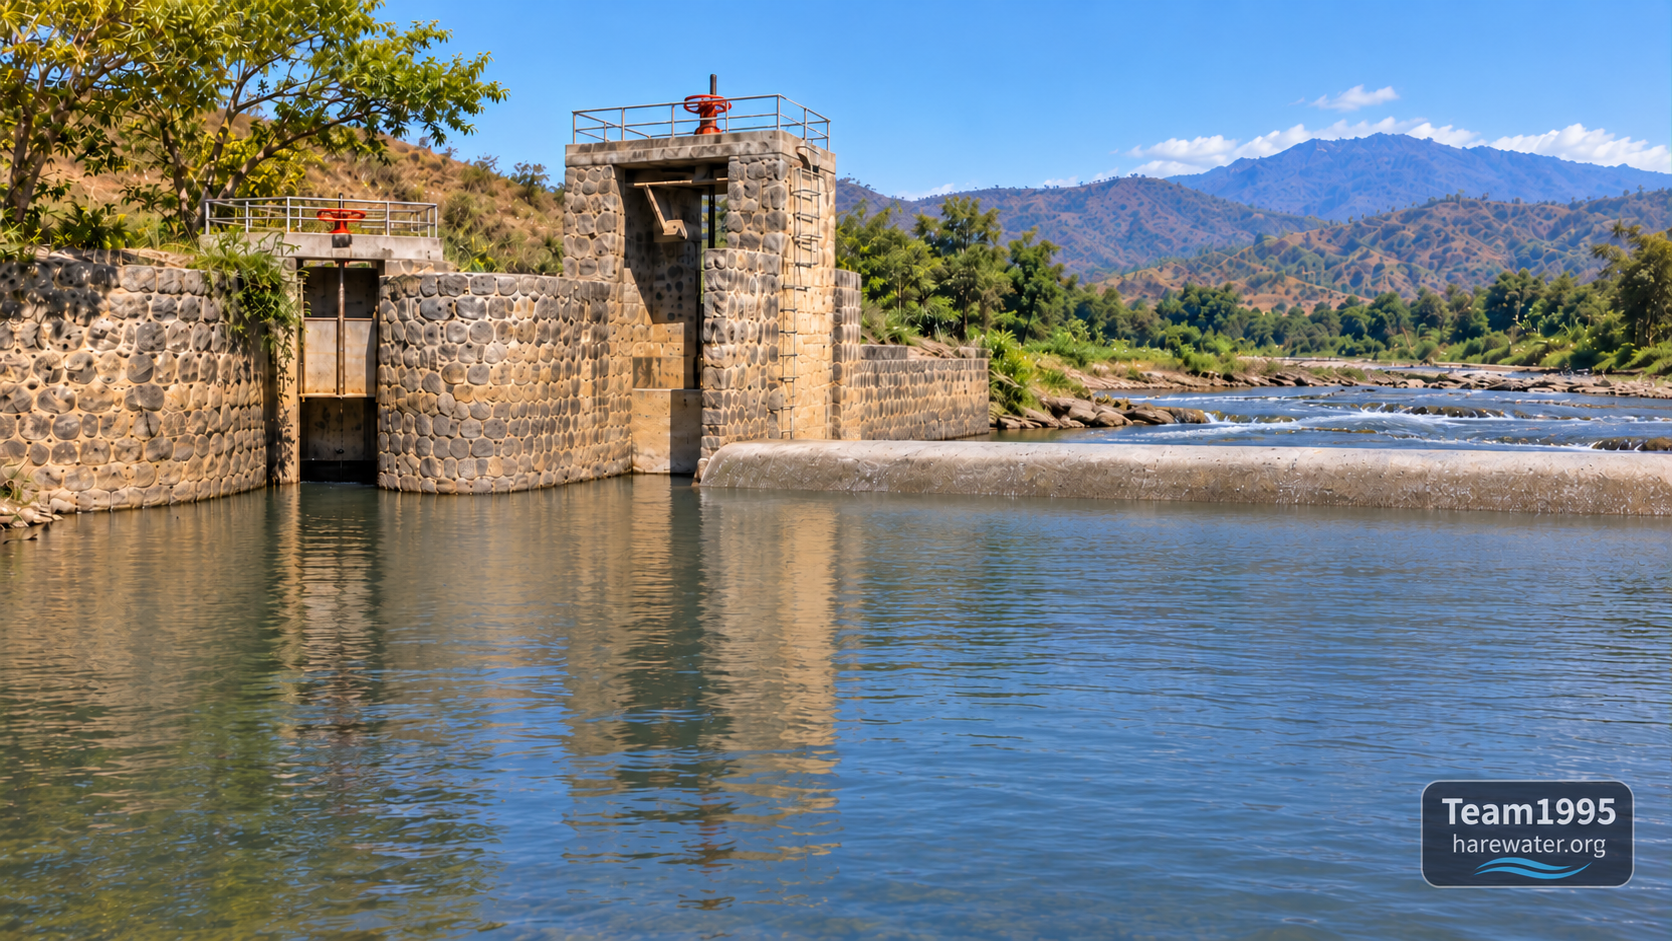
Reconstructed upstream interpretation of the diversion
weir, intake, sluice opening and gate-operating
arrangements visible in the present field record.
Current engineering relevance:
the headworks assessment is now being considered together with
HEC-HMS flood hydrology, SWAT watershed behaviour and the
substantial sediment accumulation visible around the diversion.
Sediment exclusion, scour, flushing, intake alignment and
desilting therefore form part of the next design stage.
Historical rainfall reconstruction
1990 Rainfall Pattern & Watershed Statistics
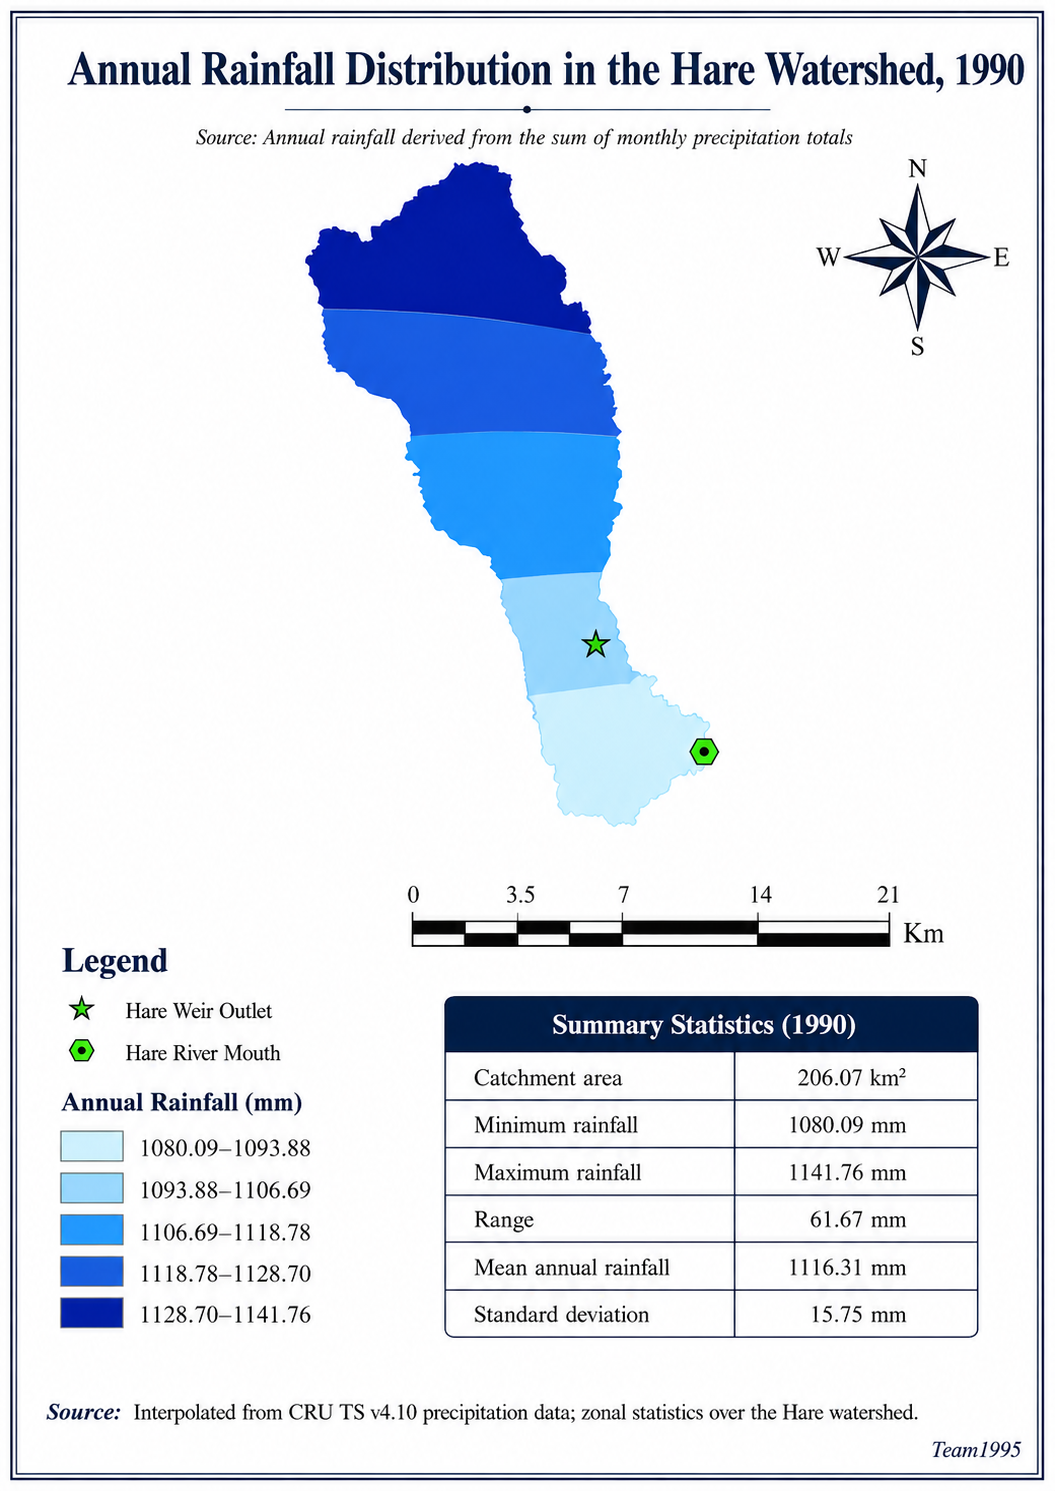
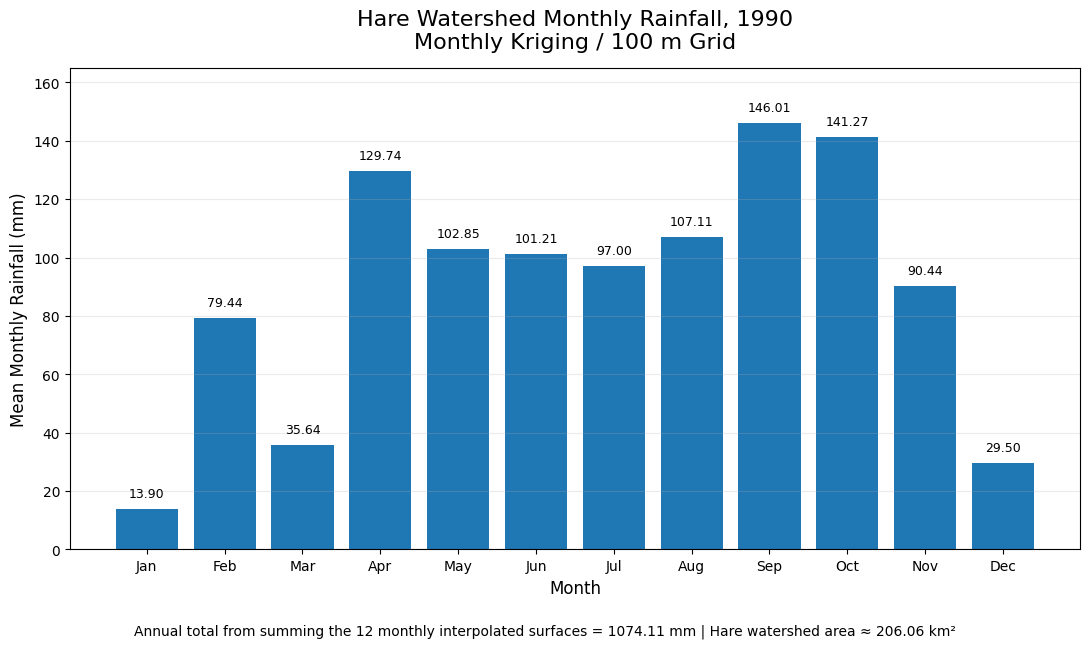
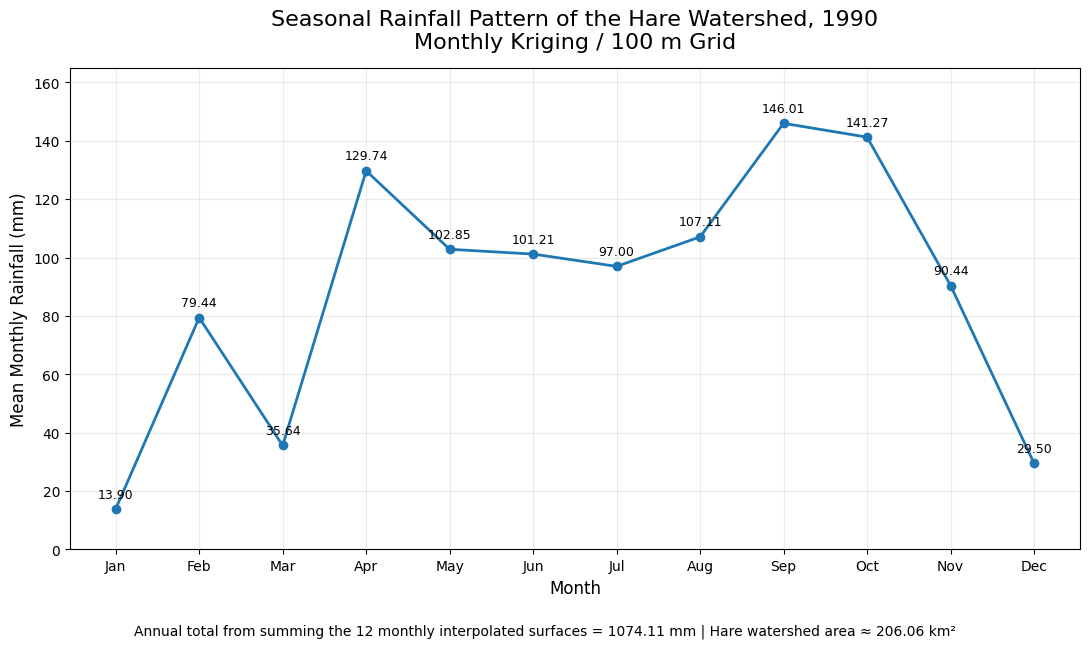
The 1990 annual rainfall map in the main library is supported
by three analytical figures: monthly rainfall, seasonal
progression and the earlier consolidated watershed-statistics
summary.
Figure 01 of 3
Hare Watershed Monthly Rainfall, 1990
Browse without returning to the figure list
Hare Watershed Monthly Rainfall, 1990
Monthly rainfall bar chart · HARE Revisited · Team1995
Published
Monthly mean rainfall over the Hare Watershed in 1990. The twelve monthly values sum to a total annual rainfall of 1,074.11 mm.
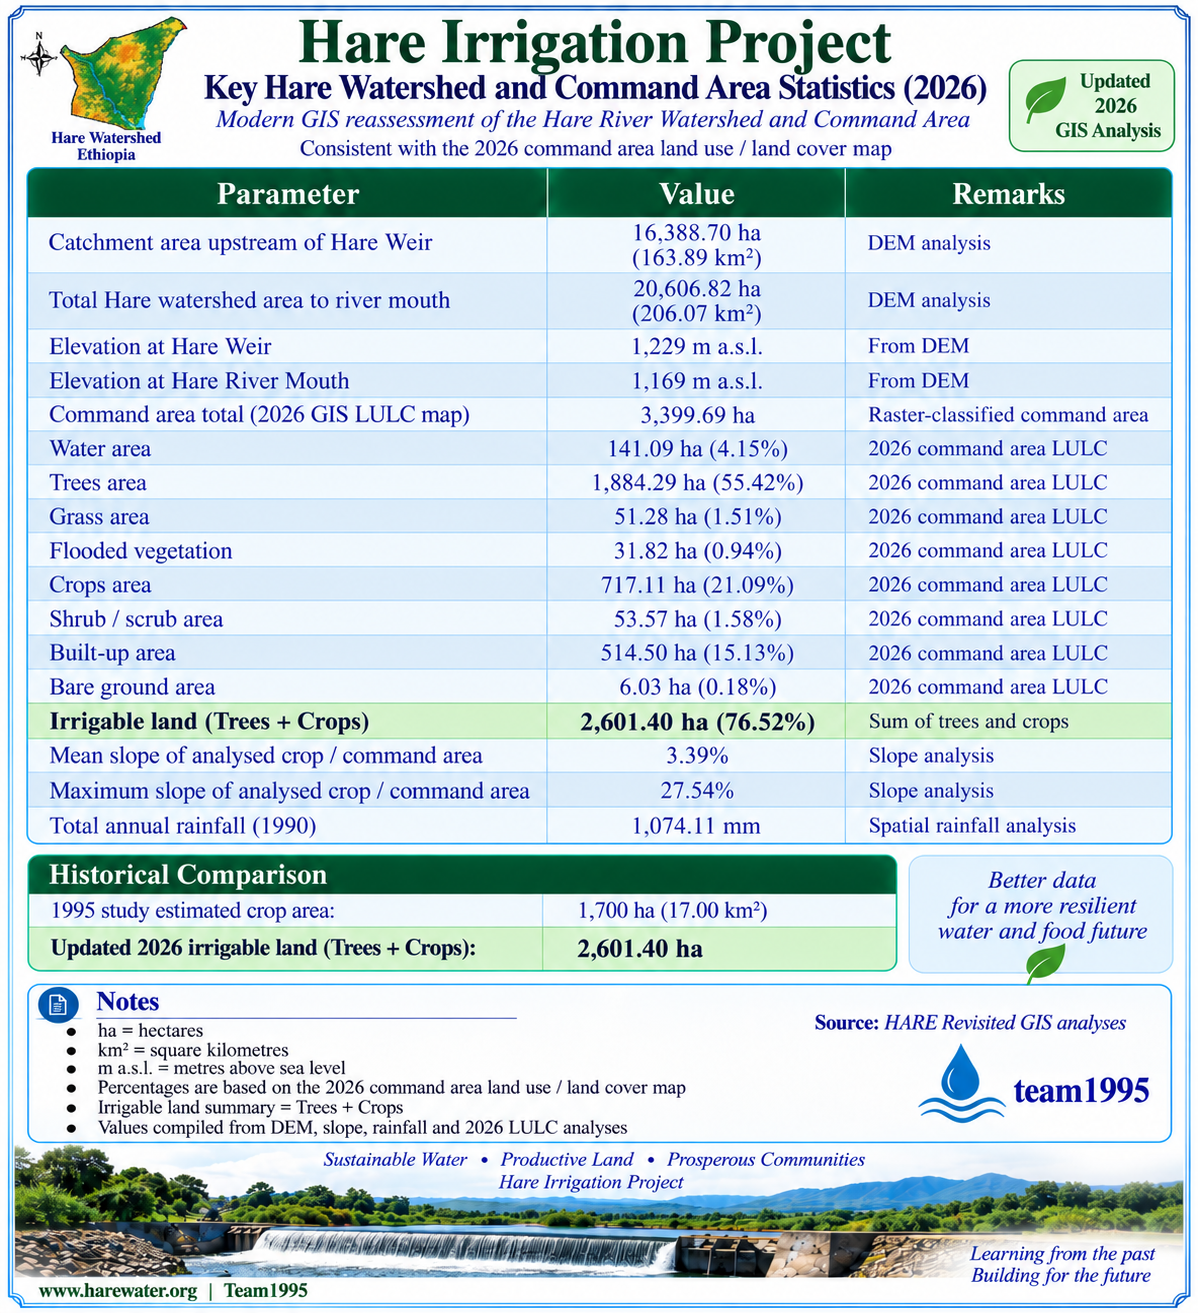
Key Hare Watershed Statistics
Watershed statistics figure · HARE Revisited · Team1995
Published
Selected GIS-derived watershed characteristics compiled during an earlier stage of HARE Revisited. The figure is retained as an archival GIS product. Its earlier Hare Weir catchment value has been superseded by the completed HEC-HMS catchment area of 162.035 km². The current SWAT model reports approximately 161.95 km² because of model-specific delineation and reporting.
Catchment-area clarification:
the earlier statistics graphic is retained as an archival
product. The completed HEC-HMS delineation uses
162.035 km², while the SWAT Error Checker
reports approximately 161.95 km². These are
model-specific representations of the same Hare Weir watershed
and should be reported separately rather than silently forced
into one value.
Current status
A Spatial Archive Now Connected to the Complete Modelling Story
The main technical library now contains
22 published products, and the historical
rainfall viewer adds 3 supporting
figures. Together they document the progression from basic GIS
reconstruction to hydrological modelling, sediment interpretation
and headworks reassessment.
GIS
25 HARE presentation products are now organized in the archive.
HEC-HMS is complete. SWAT watershed delineation, HRUs,
climate preparation and two continuous simulations are
complete. The present technical focus is interpretation of
hydrology and sediment and their application to the diversion
headworks.
Total mapped Hare watershed
206.07 km²
HEC-HMS Hare Weir catchment
162.035 km²
SWAT model area
≈ 161.95 km²
HEC-HMS 50-year peak
114.4 m³/s
SWAT upland sediment yield
58.4 Mg/ha
Spatial & engineering layers
The HARE Geospatial Analysis Set
Each layer has a defined role in the reassessment. The GIS work
now feeds directly into rainfall analysis, HEC-HMS, SWAT,
irrigation reconstruction, sediment interpretation and
hydraulic-structure reassessment.
01
Project Location & Catchment
Published
The project location, Hare watershed, Hare Weir outlet and Hare River system are documented through dedicated locator and watershed maps.
02
Digital Elevation Model
Prepared · used in GIS, HEC-HMS support and SWAT
The DEM supports terrain interpretation, drainage extraction, contour and slope analysis, canal profiling and watershed delineation. It also provides the terrain basis for the ArcSWAT watershed framework.
03
Elevation, Contours & Hillshade
Published
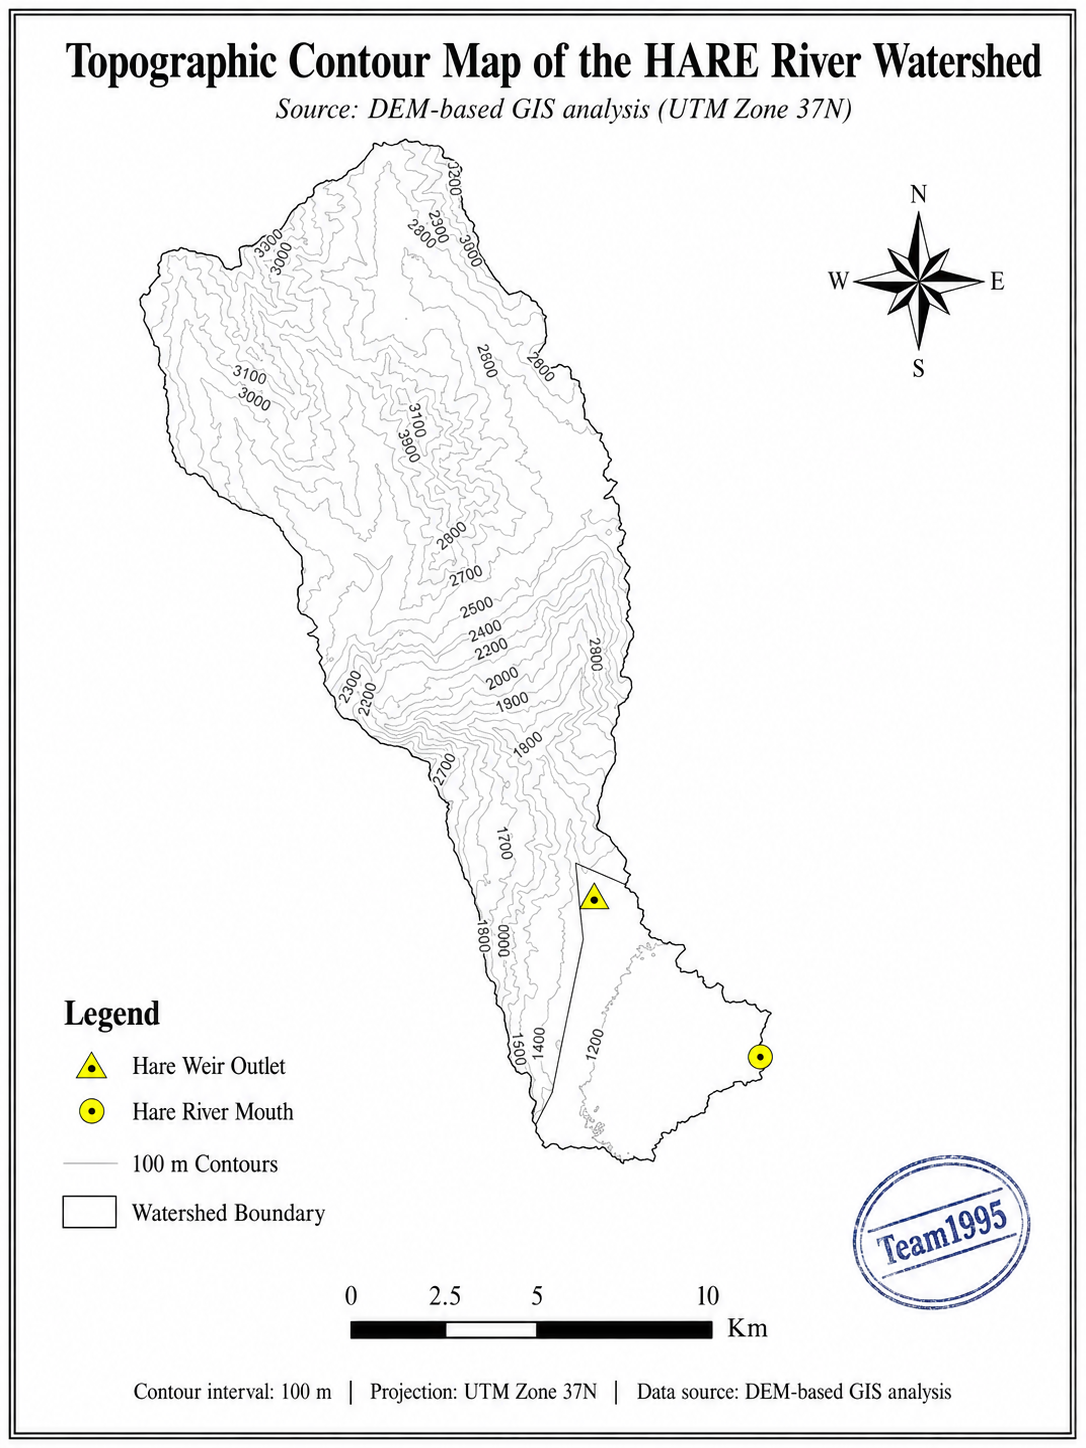
Contour and relief products document the watershed terrain and support interpretation of drainage pathways, command-area gradients and canal alignments.
04
Slope Analysis
Watershed & command-area products published
Slope analysis supports runoff and erosion interpretation, irrigation suitability, canal routing and assessment of locations where grade-control structures may be required.
05
Drainage Network
Published · SWAT delineation completed
Flow direction, flow accumulation, drainage extraction and outlet-controlled watershed delineation now form part of both the GIS archive and the completed SWAT watershed setup.
06
Land Use / Land Cover
Watershed & command-area products published
Land-use and land-cover information is documented at watershed and command-area scales and is used in irrigation interpretation, HEC-HMS Curve Number estimation and SWAT HRU development.
07
Soils & Land Suitability
Soil map published · SWAT soil layer prepared
The archive documents the mapped project soils and their engineering interpretation. Soil information is also incorporated into the hydrological modelling workflow.
The archive contains historical rainfall reconstruction and 1990 spatial products. HEC-HMS uses a separate adopted design-storm framework, while SWAT uses continuous NASA POWER meteorological forcing for the 2020–2025 simulation period.
09
Command Area & Irrigation Layout
Command-area, canal-system and longitudinal-profile products published
The current reconstruction documents the command area, Primary Canal 1, Primary Canal 2, Secondary Canal 1, the Hare River and the present irrigation system. PC1 and PC2 longitudinal profiles record terrain and grade-control requirements identified during the hydraulic reassessment.
10
Hydrological Reassessment
HEC-HMS completed · SWAT two simulations completed
HEC-HMS provides the accepted event-based 50-year design-flood simulation for the 162.035 km² Hare Weir catchment, with Q50 = 114.4 m³/s. SWAT independently provides continuous watershed behaviour for approximately 161.95 km² through 17 subbasins, including water balance, daily streamflow, groundwater, erosion and sediment processes.
11
Sediment & Headworks
SWAT sediment assessment + field evidence documented
SWAT identifies upland erosion, localized sediment hotspots and strong modelled channel deposition. Field photographs at the Hare diversion independently show coarse and finer sediment accumulation. The next engineering work therefore links catchment erosion control with scour, flushing, intake alignment, sediment exclusion and desilting.
HARE Revisited workflow
From Source Data to Engineering Reassessment
The modern work follows a traceable sequence. Spatial data
establish the physical system, HEC-HMS addresses event-scale
design flooding, SWAT addresses continuous watershed behaviour,
and the resulting hydrology and sediment evidence are carried
forward into irrigation and headworks engineering.
01
Source Data
Compile DEM, satellite, rainfall, climate, land-use, soil, field and historical project information.
02
Terrain
Prepare DEM, contours, hillshade, slopes and longitudinal terrain profiles.
03
Catchment
Derive drainage, flow accumulation, outlets, watershed boundaries and subbasins.
04
Land & Irrigation
Reconstruct land use, soils, command area, canals and irrigation-system geometry.
05
HEC-HMS
Develop event-based rainfall-runoff modelling and the accepted 50-year design-flood hydrograph.
06
SWAT
Build HRUs, climate forcing and continuous simulations for water balance and daily watershed response.
07
Sediment
Interpret erosion, sediment hotspots, channel deposition and present field evidence.
08
Engineering
Compare with 1995 and apply the modern evidence to canals, headworks and sediment-management design.
HARE Revisited
1995 Engineering Understanding → Modern Spatial & Model Evidence
The modern work does not overwrite the original HARE study.
The 1995 report remains the historical engineering record.
Modern GIS, rainfall reconstruction, HEC-HMS, SWAT and field
observations form a separate evidence layer that allows the
earlier design assumptions and present conditions to be compared
transparently.
Original HARE study · 1995
Historical Engineering Evidence
Original project maps and drawings
Field reconnaissance and site information available to the team
Historical rainfall and river-flow records
Manual and tabulated hydrological calculations
Canal, regulator and diversion-headworks calculations
Irrigation engineering based on the tools and standards available at the time
→
Modern reassessment · 2026
GIS, Hydrological Models & Field Evidence
Modern DEM and terrain derivatives
Digitally delineated drainage and watershed boundaries
Satellite-based land-use and command-area reconstruction
Historical rainfall reconstruction and modern climate datasets
SWAT erosion, sediment hotspot and channel-deposition assessment
Present photographs and videos of the Hare river, canals and headworks
Integrated sediment-management and headworks reassessment
Technical outputs
Published, Current & Next Engineering Outputs
The archive now contains substantial GIS, rainfall, canal,
HEC-HMS and SWAT material. The immediate next stage is no longer
simply another watershed model; it is to use the accumulated
hydrological and sediment evidence in the engineering
reassessment of the Hare diversion headworks.
Project-location and catchment maps
Digital elevation model, contours and hillshade
Watershed and command-area slope products
Flow-direction, flow-accumulation and drainage analysis
Land-use / land-cover maps
Soil and land-resource map
Historical rainfall and hydroclimate figures
Command-area and canal-system reconstruction
PC1 and PC2 longitudinal profiles and drop-structure interpretation
SWAT watershed delineation — 17 subbasins / approximately 161.95 km²
SWAT Simulation 2 hydrology summary
SWAT Simulation 2 sediment summary
Field sedimentation evidence at the Hare diversion
Historical-period SWAT calibration study — future stage
Integrated sediment-control and headworks reassessment — current engineering stage
1995 versus modern engineering comparison sheets
Publication principles
Measured First, Published Second
No invented spatial statistics
Areas, slopes, land-use percentages, elevations,
coordinates and hydraulic dimensions are published only
when derived from the project data or clearly identified
engineering assumptions.
Historical and modern evidence remain distinct
Original 1995 information is kept separate from GIS-derived,
modelled and present-day evidence so that the archive remains
technically transparent.
Model limitations remain visible
HEC-HMS event results, SWAT daily results, archived
sensitivity cases and uncalibrated sediment diagnostics are
labelled according to their actual modelling purpose and
present level of verification.
Continue through the complete HARE technical story
The spatial archive now connects directly to the original
project, the engineering book and the dedicated HEC-HMS and
SWAT modelling workspaces.