Storm Duration
24 hours
The complete design rainfall depth is distributed through one day.
This page documents the preparation of the Hare rainfall input used in HEC-HMS: daily rainfall, annual maximum rainfall, frequency analysis, adopted return-period rainfall depths and the temporal design storm applied to the event simulations.
Assemble and quality-check the daily rainfall record for the Hare watershed, including dates, units, missing values and spatial coverage.
Identify the largest daily catchment-average rainfall event in each year and build the annual-maximum series used for frequency analysis.
Estimate return-period rainfall depths from the annual-maximum rainfall series.
Convert the selected design depth into incremental time blocks that sum to the required storm rainfall.
Enter the final storm distribution using the adopted computation interval and run the design-event simulations.
The first stage of the rainfall analysis used the initial annual-maximum daily rainfall series. These values were useful for establishing the frequency-analysis procedure and early HEC-HMS rainfall preparation.
| Year | Date | Area Mean (mm/day) | Max Pixel (mm/day) |
|---|---|---|---|
| 1981 | 1981-07-30 | 41.91 | 47.53 |
| 1982 | 1982-11-28 | 36.96 | 50.24 |
| 1983 | 1983-07-25 | 44.14 | 53.13 |
| 1984 | 1984-05-29 | 58.47 | 78.82 |
| 1985 | 1985-05-23 | 38.84 | 45.39 |
| 1986 | 1986-08-10 | 42.46 | 62.06 |
| 1987 | 1987-05-21 | 44.09 | 53.02 |
| 1988 | 1988-05-19 | 44.69 | 59.12 |
| 1989 | 1989-10-20 | 50.46 | 65.59 |
| 1990 | 1990-07-21 | 52.13 | 70.87 |
The rainfall analysis was later extended and corrected using the true Hare Weir catchment represented by the final HEC-HMS basin model. The corrected catchment area is 162.035 km², and the complete CHIRPS record contains 45 years from 1981 through 2025.
For every calendar year, the complete daily CHIRPS series was searched and the date having the greatest spatial mean rainfall over the Hare Weir catchment was selected. The result is one annual maximum daily catchment-average rainfall value for each year.
This value is especially important because it is not a single high-value pixel. It is the daily spatial average over the complete 162.035 km² Hare Weir catchment on the wettest catchment-average day found in the full 1981–2025 record.
The final corrected 45-value annual-maximum series was used to recalculate the Gumbel frequency analysis for the true Hare Weir catchment.
| Return Period | Corrected Gumbel Rainfall (mm) |
|---|---|
| 2 years | 55.92 |
| 5 years | 69.70 |
| 10 years | 78.83 |
| 25 years | 90.36 |
| 50 years | 98.92 |
| 100 years | 107.41 |
The following 24-hour rainfall depths are the values already used or prepared for the current HEC-HMS design-event simulations. They are kept here exactly as documented in the simulation-run record.
| Return Period | Adopted HEC-HMS P24 (mm) | Model Status |
|---|---|---|
| 10 years | 49.61 | Prepared for design-event simulation |
| 25 years | 54.99 | Prepared for design-event simulation |
| 50 years | 58.98 | Used in the completed reference run |
| 100 years | 62.95 | Prepared for design-event simulation |
HEC-HMS requires rainfall to be distributed through time rather than entered only as a single daily or 24-hour total. The selected design rainfall must therefore be converted into shorter-duration cumulative depths and then into incremental rainfall blocks.
24 hours
The complete design rainfall depth is distributed through one day.
15 minutes
The HEC-HMS design-event simulations use a 15-minute computation interval.
72 hours
The longer window allows the full flood hydrograph and recession to pass.
Σ incremental rainfall = selected storm depth
The final hyetograph must reproduce the adopted event total.
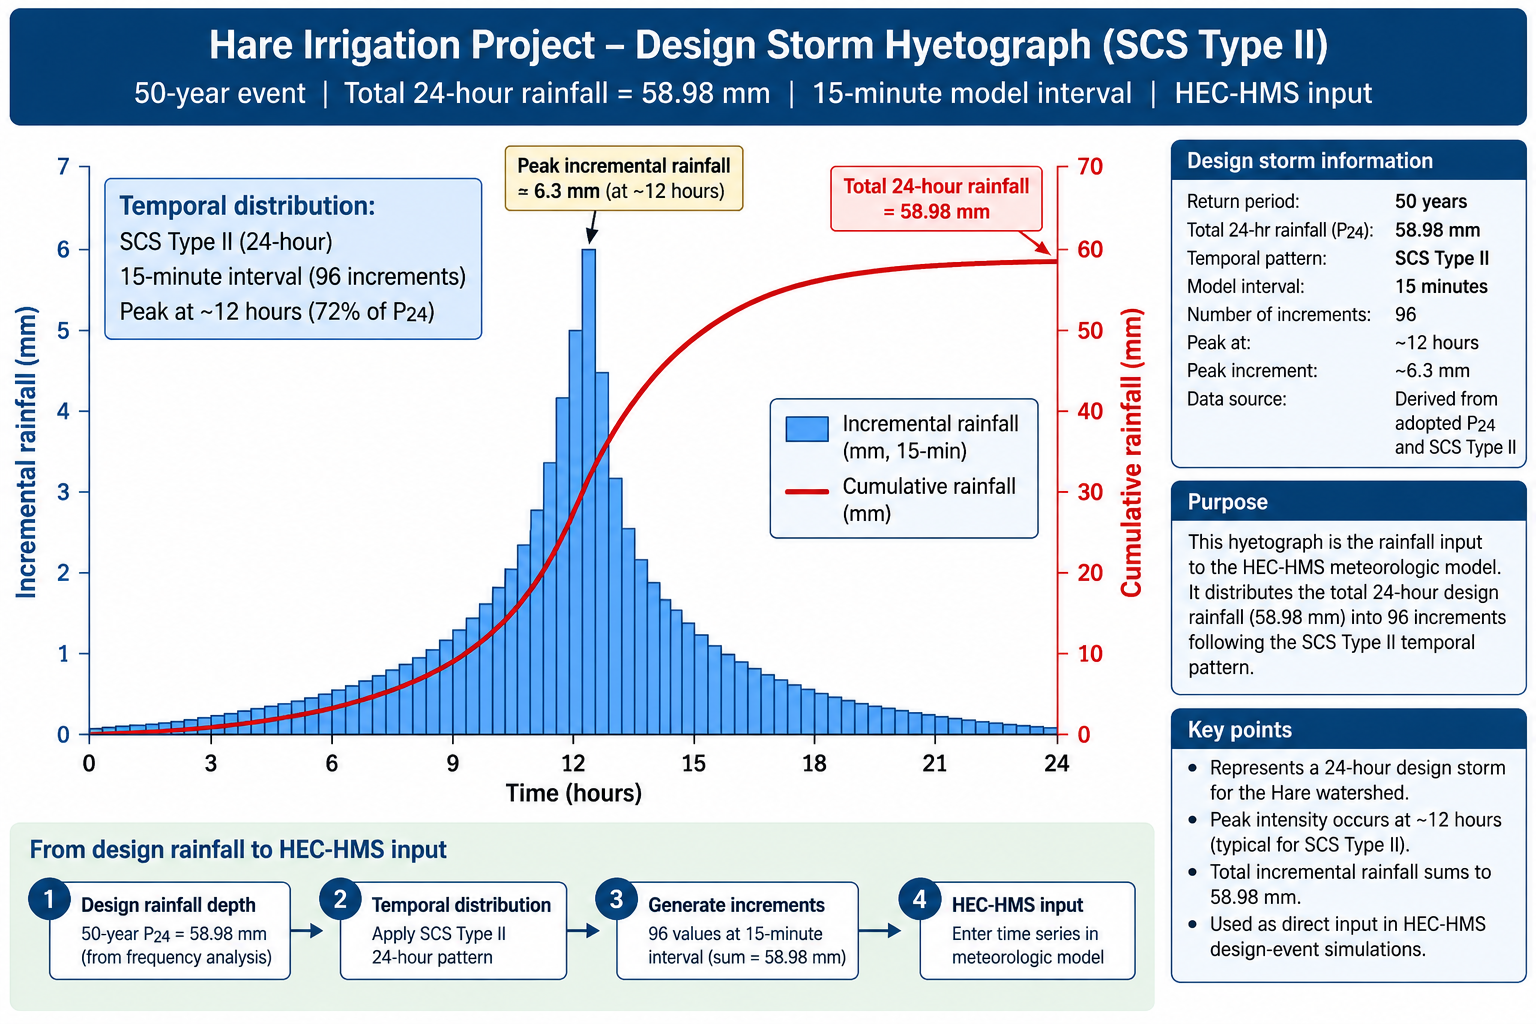
The figure below documents the temporal distribution of the adopted 50-year HEC-HMS design storm. The total rainfall depth is 58.98 mm over 24 hours, distributed according to the SCS Type II temporal pattern at a 15-minute model interval.
The blue bars represent incremental rainfall applied during each model time step, while the cumulative curve shows the progressive total rainfall through the storm. The sum of all incremental rainfall blocks is equal to the adopted 24-hour design depth.
The detailed corrected annual-maximum table, revised Gumbel calculation and corrected depth-duration analysis are retained below as the technical audit trail for the final Hare rainfall analysis.