Design Rainfall
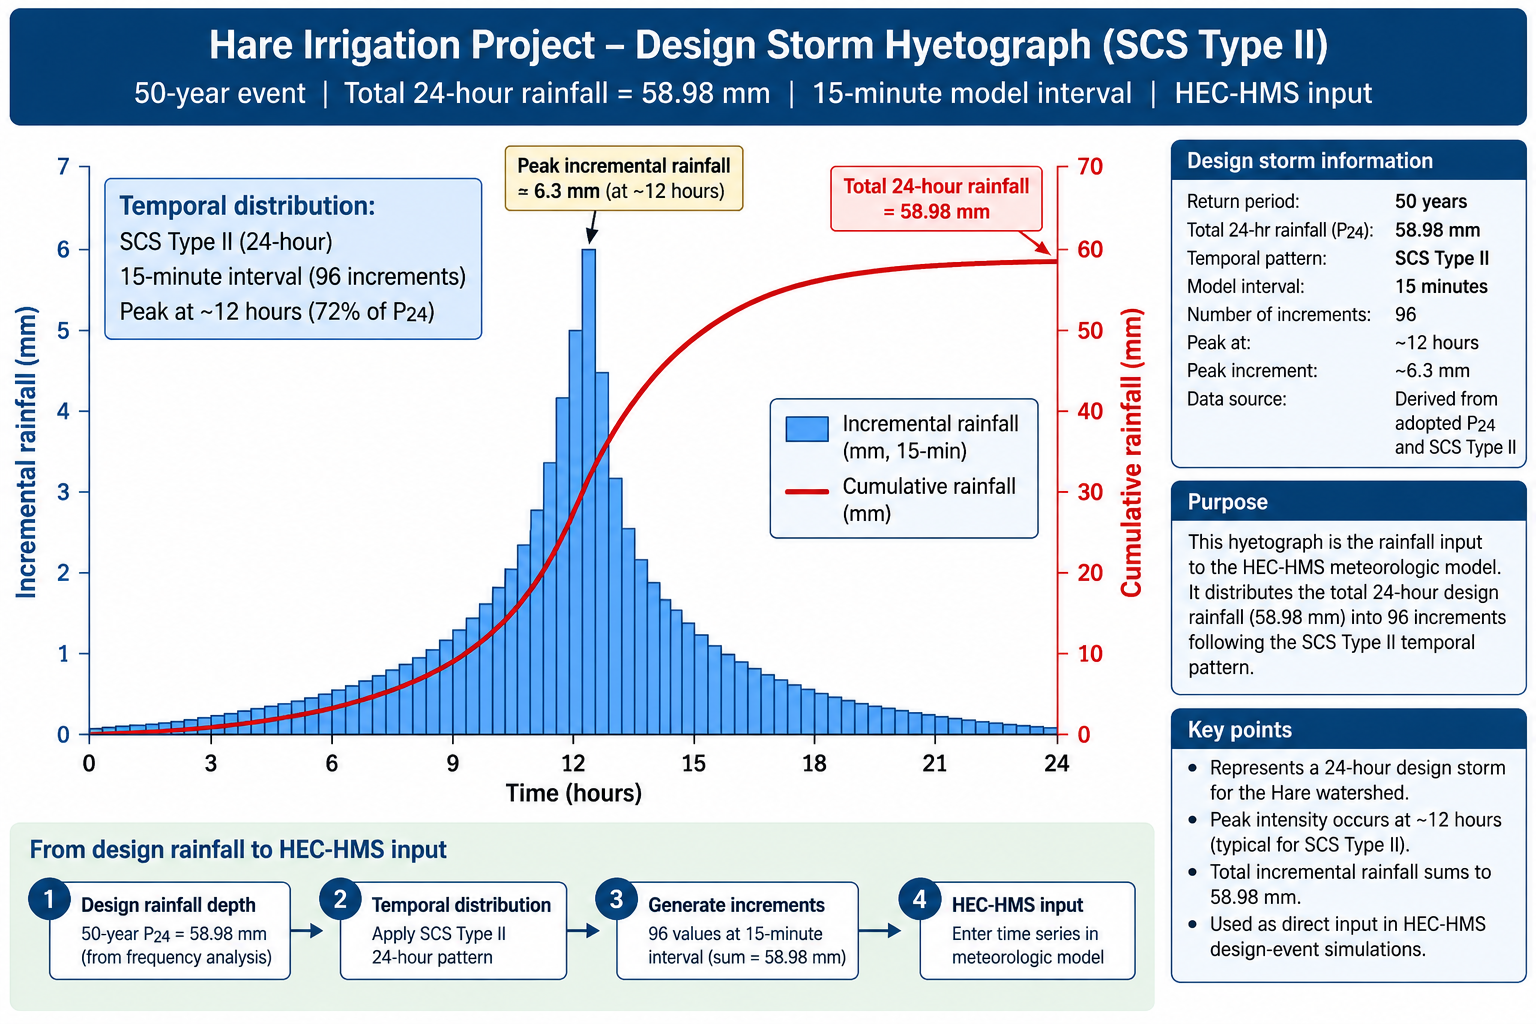
58.98 mm
24-hour synthetic design storm.
The HEC-HMS results describe the design-flood response of the 162.035 km² Hare River watershed at the Hare Weir / irrigation headworks. The current accepted reference simulation is the 50-year design event.
| Return Period | 24-h Rainfall (mm) | Peak Q (m³/s) | Runoff Depth (mm) | Status |
|---|---|---|---|---|
| 10 years | 49.61 | — | — | Not yet finalised |
| 25 years | 54.99 | — | — | Result to be confirmed |
| 50 years | 58.98 | 114.4 | 16.84 | Completed / accepted |
| 100 years | 62.95 | — | — | Not yet finalised |
The 50-year event is the present reference simulation for the Hare headworks reassessment. All basin geometry, loss, transform and routing settings are those documented in the final HEC-HMS model.
58.98 mm
24-hour synthetic design storm.
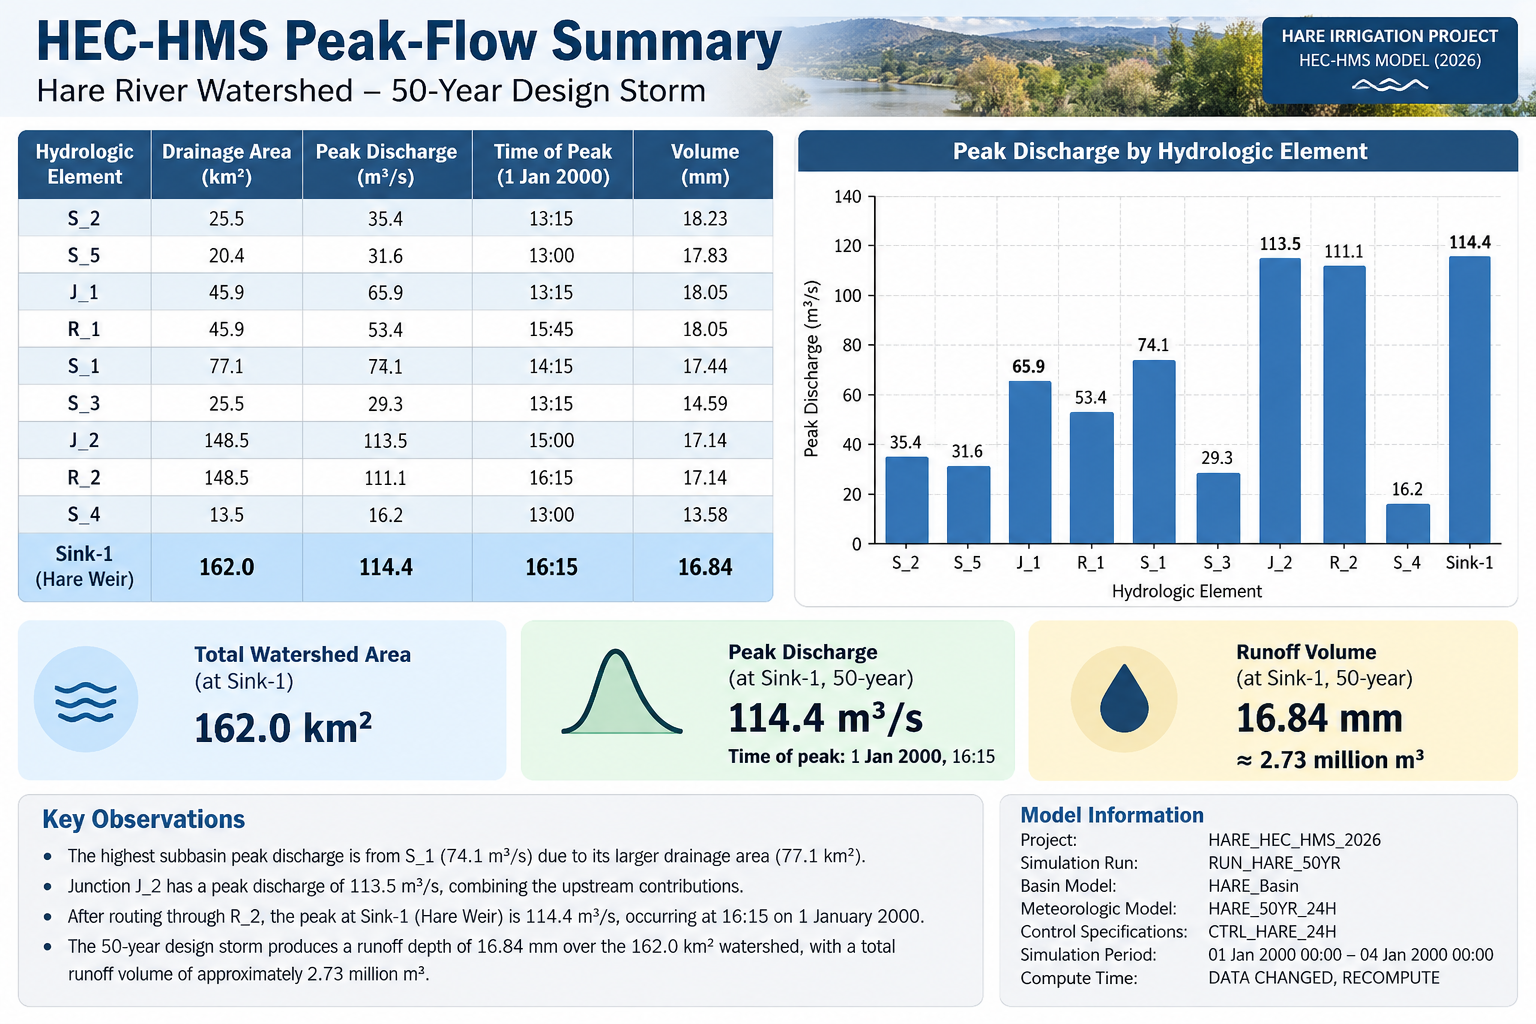
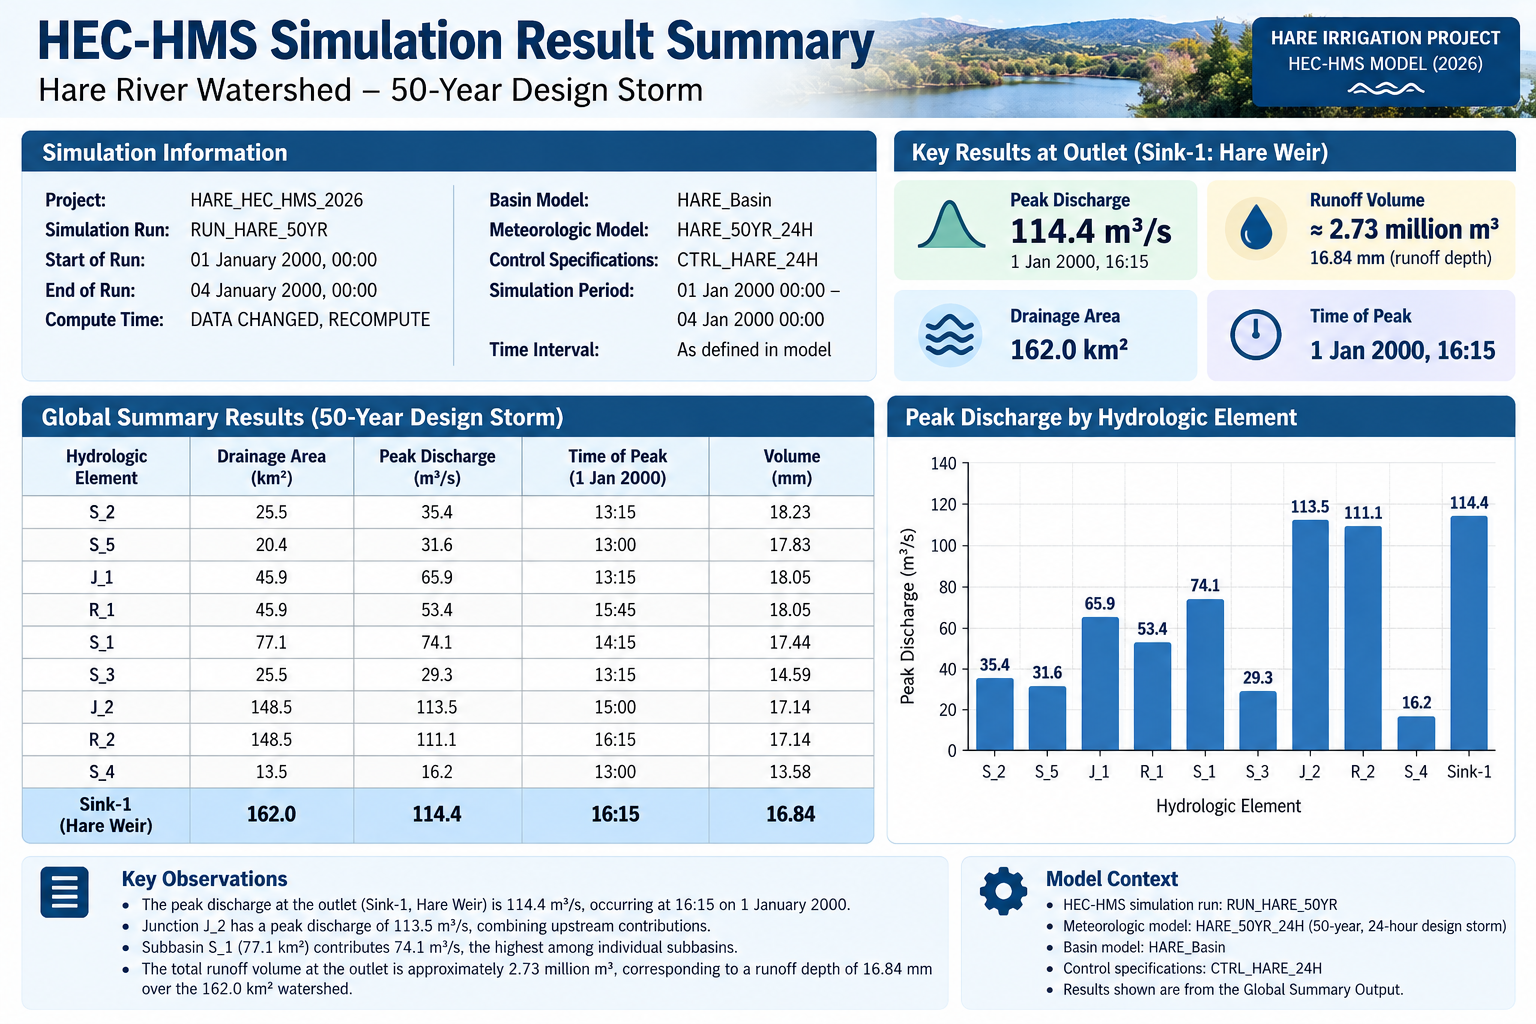
114.4 m³/s
Peak discharge at Sink-1 / Hare Weir.
16.84 mm
Direct runoff generated by the accepted event simulation.
≈ 2.73 million m³
Approximate basin runoff volume corresponding to the reported runoff depth over 162.035 km².
Simulation Day 1 · approximately 16:15
Peak occurs after the principal design-storm rainfall pulse and upstream routing response.
Sink-1 / Hare Weir
Final discharge extraction point for the irrigation diversion and headworks assessment.
The outlet hydrograph is the principal HEC-HMS result used for hydraulic design. It describes not only the maximum flow, but also the timing, duration and recession of the flood wave arriving at the Hare Weir.

At the time of the accepted 50-year outlet peak, most of the discharge arriving at Sink-1 is routed from the upstream watershed through R_2. A smaller local contribution is added from S_4 near the downstream end of the basin model.
≈ 111.1 m³/s
Routed upstream contribution arriving through reach R_2 at the time of the outlet peak.
≈ 3.2 m³/s
Local runoff contribution from S_4 at approximately the same peak time.
The accepted 50-year event produces a direct runoff depth of 16.84 mm. Applied across the full modelled watershed, this corresponds to approximately 2.73 million m³ of runoff volume.
Runoff Volume = Runoff Depth × Watershed Area
0.01684 m × 162.035 × 106 m² ≈ 2.73 × 10⁶ m³
This volume represents the storm-generated runoff simulated by the event model. Because baseflow is set to None, it should not be interpreted as the total volume of river flow that would occur during the same period in a continuous hydrologic simulation.
The following figures provide the graphical record of the adopted 50-year HEC-HMS simulation. The design-storm hyetograph is retained here as the rainfall-input reference; the remaining figures document the resulting watershed response and HEC-HMS outputs.


The HEC-HMS result provides the flood hydrograph required for evaluating the hydraulic adequacy and safety of the Hare diversion structures. The design flow must be considered together with the geometry and hydraulic capacity of the weir, under-sluice, approach reach, head regulator and associated river-control works.
The accepted 50-year peak of 114.4 m³/s is therefore not treated as an isolated number. Its timing, hydrograph shape and runoff volume are also relevant to hydraulic loading and flood passage through the headworks.
The accepted HEC-HMS 50-year peak is compared separately with the historical 1995 Log-Pearson Type III estimate. The modern rainfall-runoff simulation gives 114.4 m³/s, whereas the historical 50-year statistical estimate was 59.183 m³/s.
The difference is retained explicitly as part of the engineering record and is discussed on the Validation & 1995 Comparison page.
| Output | Status |
|---|---|
| 50-year rainfall input | Final — 58.98 mm / 24 h |
| 50-year peak discharge | Final — 114.4 m³/s |
| 50-year runoff depth | Final — 16.84 mm |
| 50-year runoff volume | Final — approximately 2.73 million m³ |
| 50-year peak timing | Recorded — approximately Day 1, 16:15 |
| 10-year event | Not yet finalised |
| 25-year event | Final outlet result to be confirmed |
| 100-year event | Not yet finalised |
| Graphical result elements | Completed — final figures inserted |
| SWAT comparison | Next independent hydrologic stage |
| Watershed Area | 162.035 km² |
|---|---|
| Reference Event | 50-year design storm |
| 24-hour Rainfall | 58.98 mm |
| Peak Discharge | 114.4 m³/s |
| Runoff Depth | 16.84 mm |
| Approx. Runoff Volume | 2.73 million m³ |
| Peak Time | Simulation Day 1 · approximately 16:15 |
| Outlet | Sink-1 / Hare Weir |
| Next Hydrologic Check | SWAT watershed simulation |
These results complete the present HEC-HMS design-event record for the accepted 50-year simulation. Additional return-period results and future graphical elements can be added without changing the underlying page structure.