01
Design event
The final hydraulic assessment represents the 50-year design flood generated from the HEC-HMS catchment model.
The HARE Irrigation Project was reconstructed in HEC-RAS 2D to examine the hydraulic response of the river system under the 50-year design flood. The final model integrates terrain, hydraulic roughness, a HEC-HMS inflow hydrograph, rainfall forcing and downstream boundary conditions to evaluate water depth, velocity, water-surface response and the hydraulic basis of the diversion headworks.
The final HEC-RAS simulation uses the 50-year design flood derived from the HEC-HMS rainfall-runoff analysis. The resulting inflow hydrograph was introduced as an upstream hydraulic boundary and routed through the HARE 2D domain.
The model was used to examine flood-wave propagation, maximum water depth, velocity distribution and water-surface elevation. These results provide an additional hydraulic basis for interpreting the reconstructed HARE diversion weir, canal entrance and sediment-control arrangement.
The final hydraulic assessment represents the 50-year design flood generated from the HEC-HMS catchment model.
Terrain_cell10, land-cover roughness and 73,987 computational cells were used to represent the HARE river and surrounding terrain.
Maximum depth, velocity and stage-flow hydrographs were reviewed for hydraulic plausibility and interpretation.
Terrain and hydraulic results were combined with field observations to reconstruct approximate weir, canal and sediment-excluder levels.
Overall volume-accounting error was approximately 0.005841%, indicating excellent numerical mass conservation.
The principal final run used plan ups_0.045G with a 5-second computation interval.
Hydraulic roughness is one of the principal controls on flow resistance in HEC-RAS 2D. Manning's n influences simulated velocity, water depth, flood-wave travel time and the distribution of flow across the computational domain. Higher values represent rougher surfaces that provide greater resistance to flow, while lower values represent smoother surfaces through which water can generally move more easily.
The HARE model contains a land-cover layer with default Manning's n values assigned to the mapped surface classes. The original default values were 0.035 for unclassified areas, 0.15 for developed high-intensity areas, 0.08 for developed low-intensity areas, 0.04 for developed open space, 0.05 for cultivated crops and 0.04 for pasture-hay.
During development of the stable 50-year hydraulic run, the geometry overrides for active 2D flow areas 11, 12 and 13 were set to Manning's n = 0.045. This provided a consistent effective roughness within those active flow areas while retaining the land-cover layer as the underlying roughness reference. The final Manning's n representation was reviewed in RAS Mapper before the hydraulic simulation was accepted.
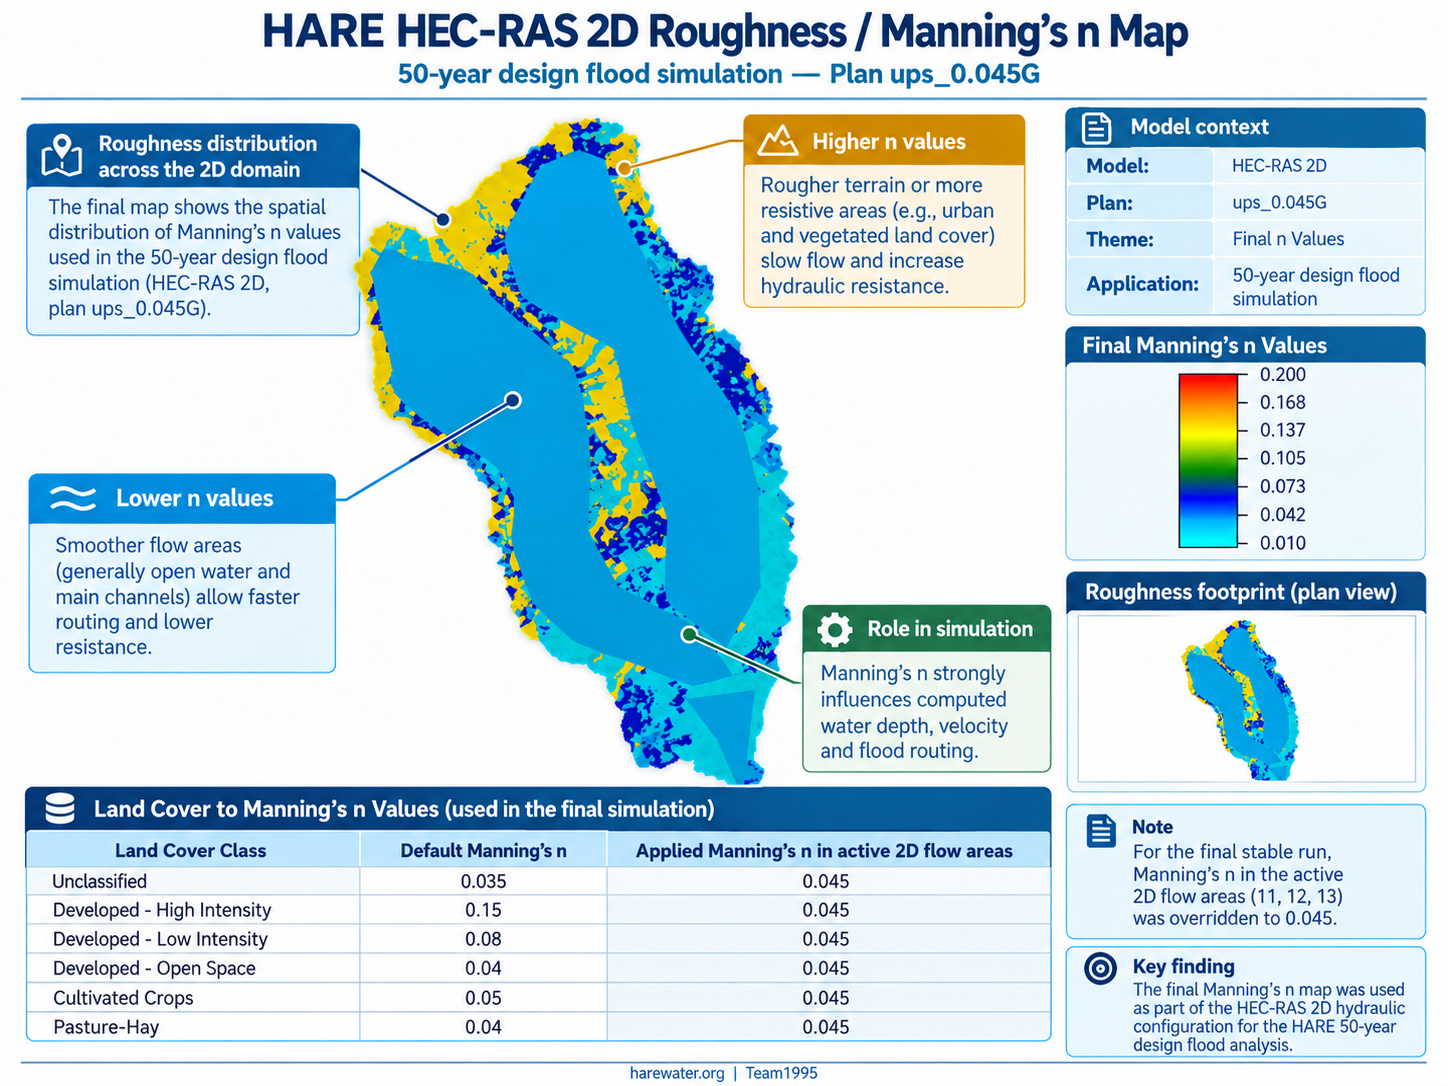
RAS Mapper representation of hydraulic roughness together with the land-cover Manning's n values used during model preparation. The final stable configuration applied an effective Manning's n of 0.045 to active 2D flow areas 11, 12 and 13.
The 50-year rainfall event was developed from the project rainfall analysis, temporally distributed into a synthetic 24-hour storm and processed through HEC-HMS. The resulting design hydrograph was then used as the upstream hydraulic boundary for the HEC-RAS 2D simulation.

Development of the synthetic design rainfall used in the HARE hydrological and hydraulic modelling workflow.
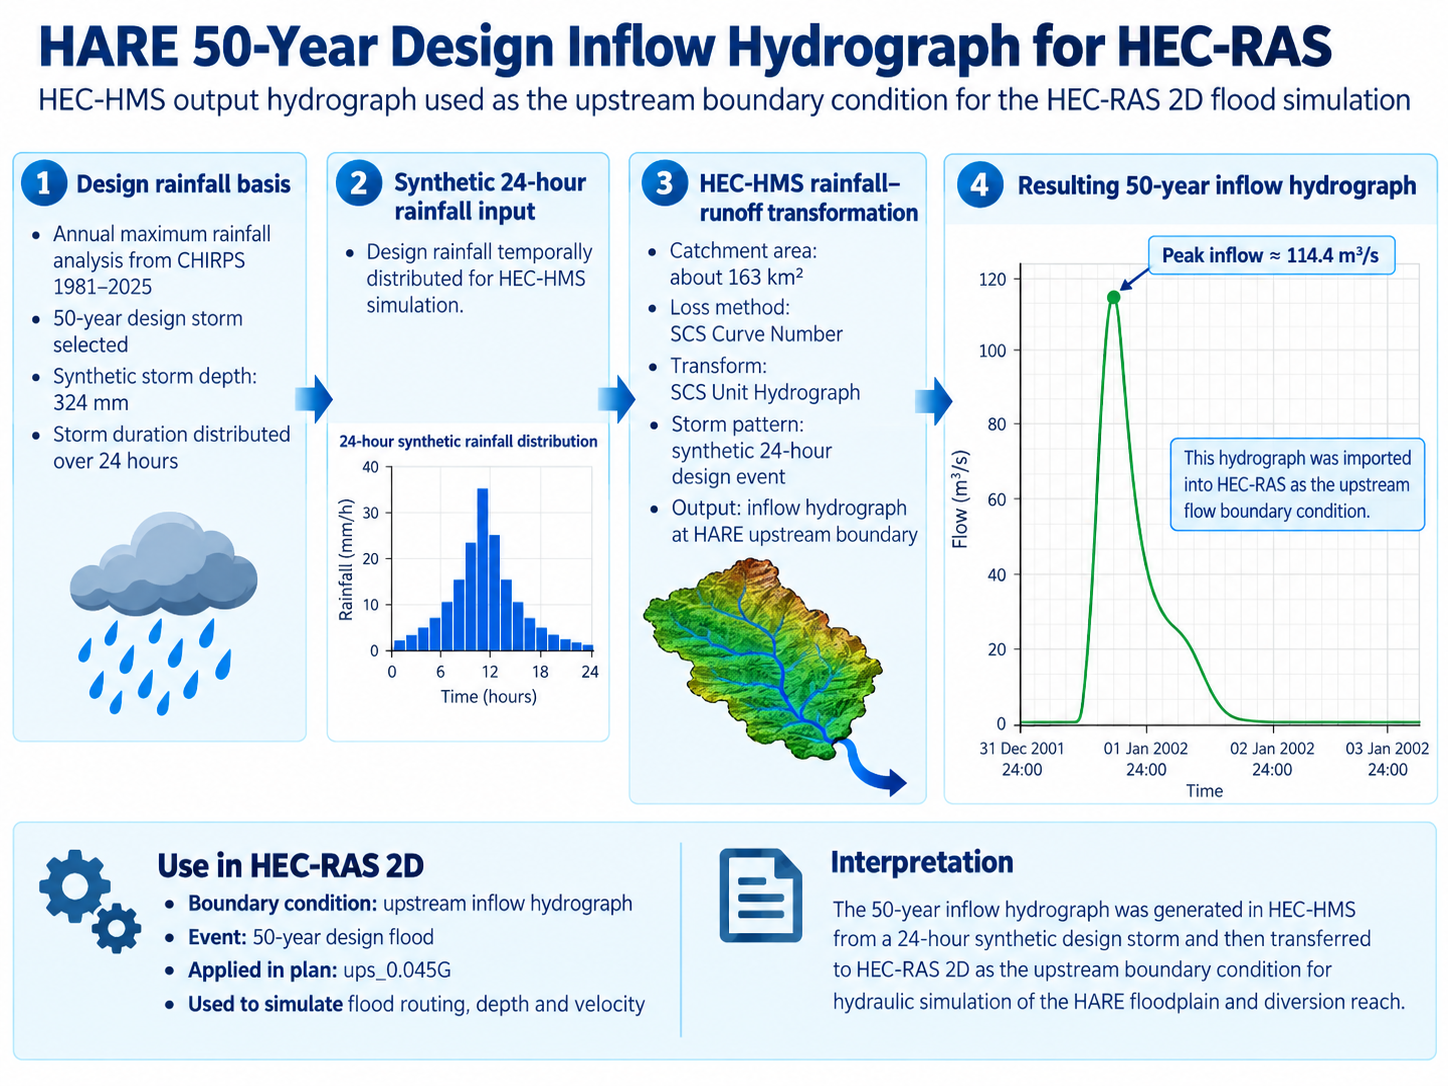
HEC-HMS runoff hydrograph transferred to HEC-RAS as the principal upstream inflow boundary condition.
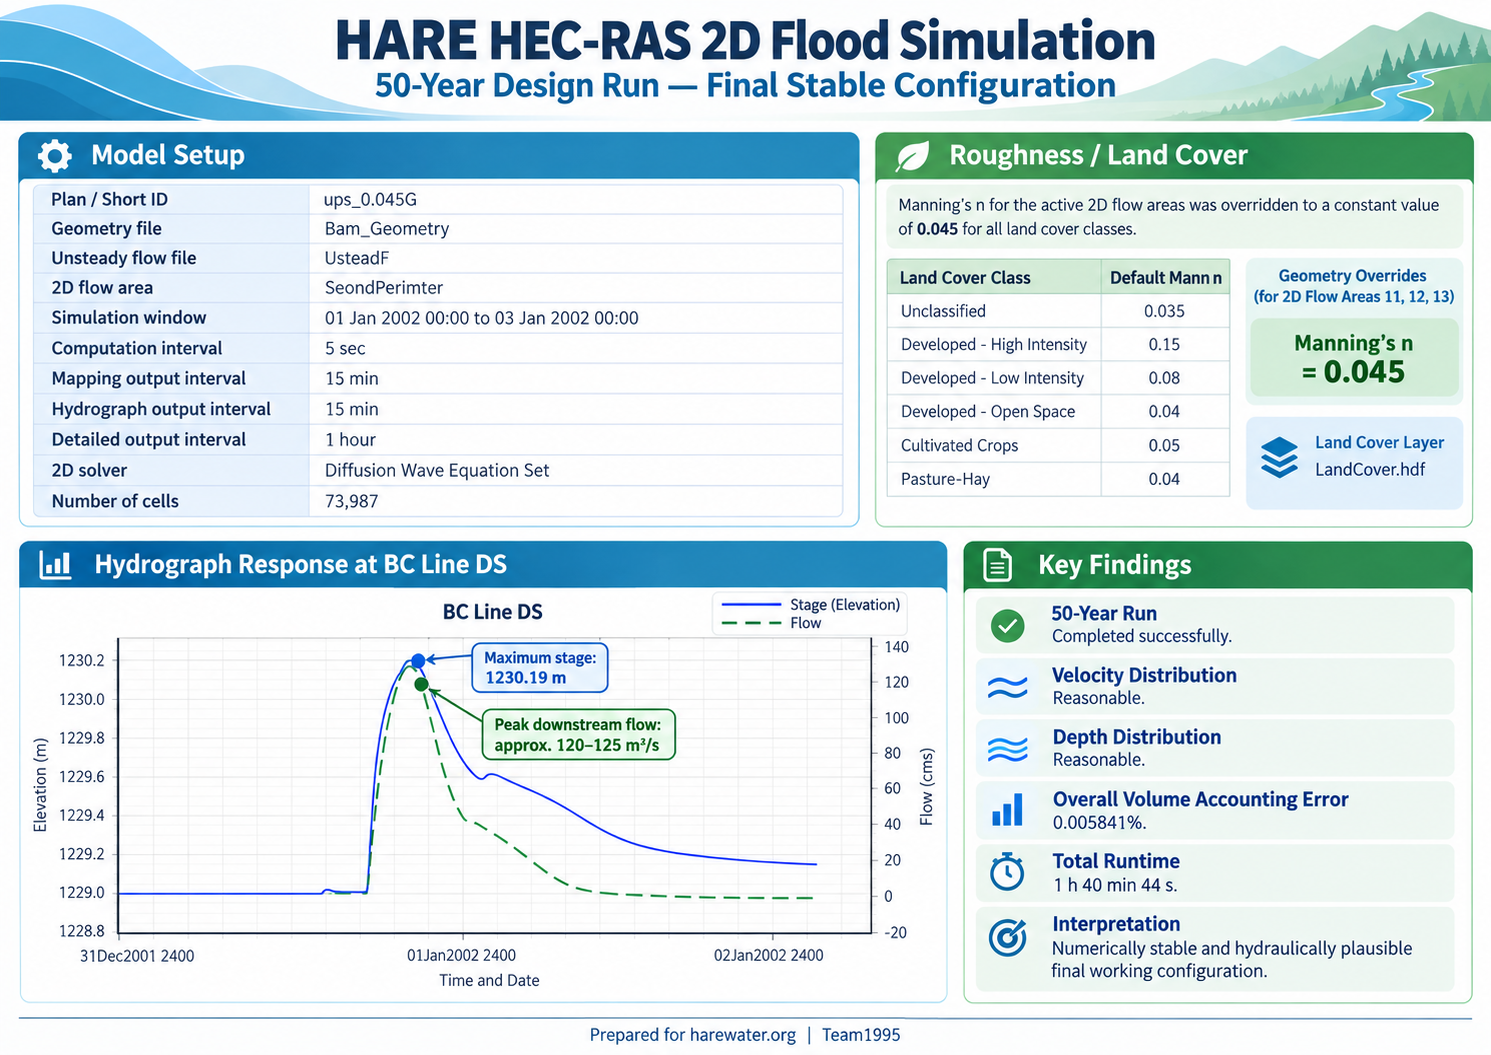
Final plan ups_0.045G, including model configuration, roughness, downstream stage-flow response and numerical performance.
Maximum velocity and depth maps show how the 50-year flood is concentrated along the principal drainage network and how hydraulic conditions change across the HARE terrain.
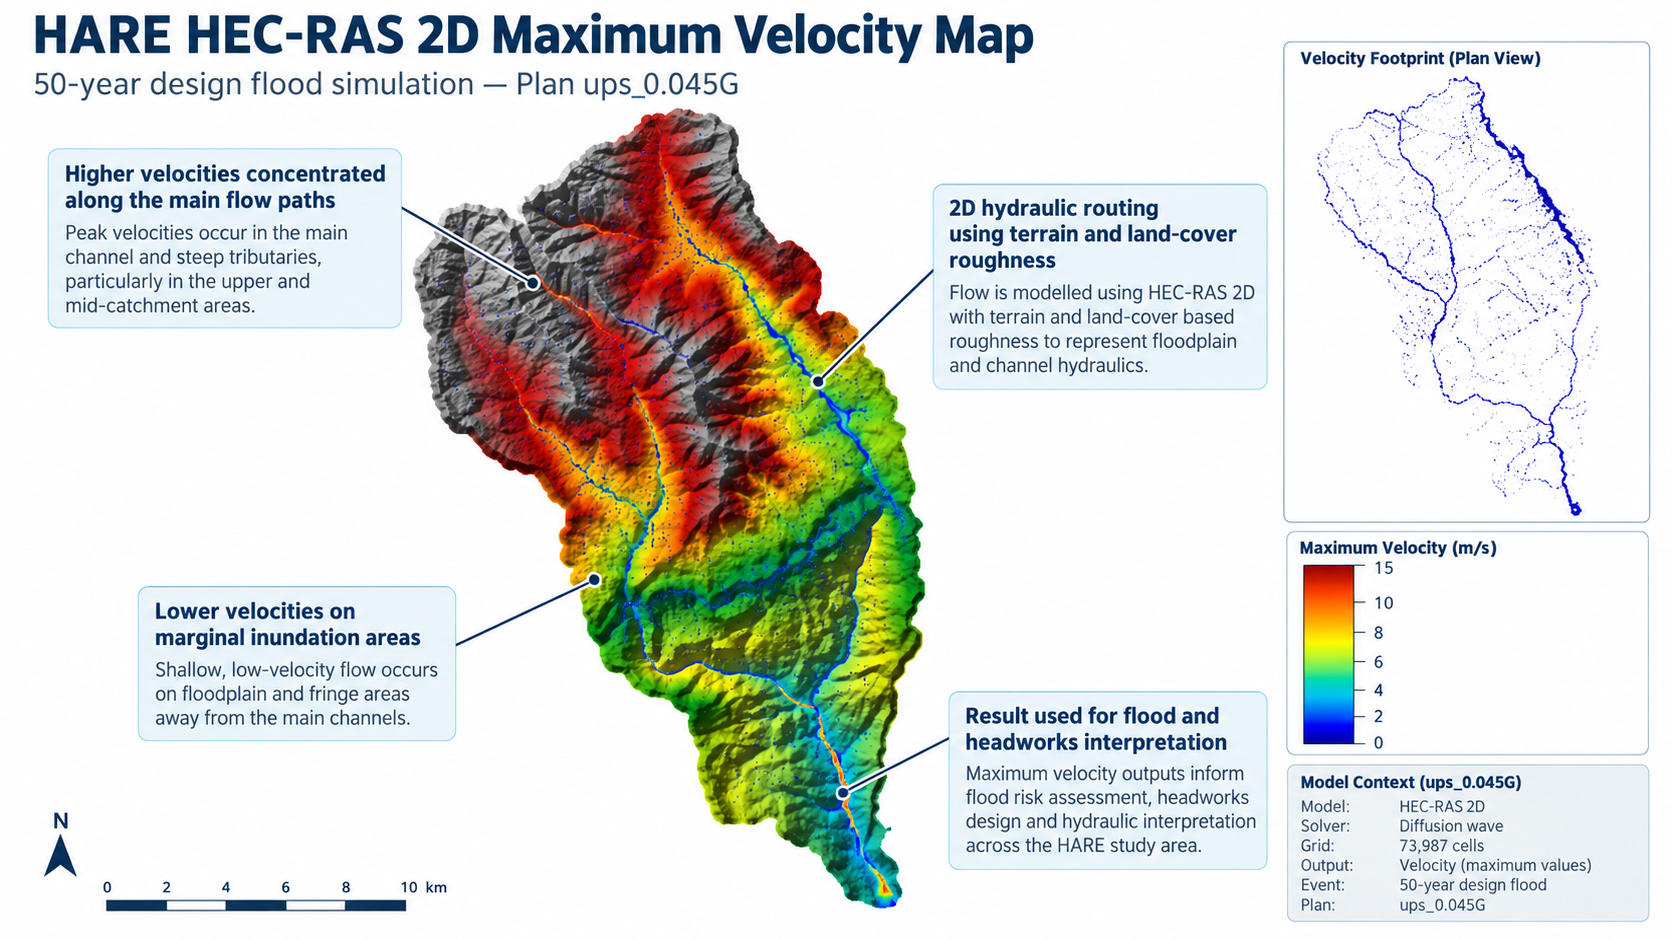
Maximum simulated velocities for the 50-year event, highlighting the principal river and tributary flow paths.
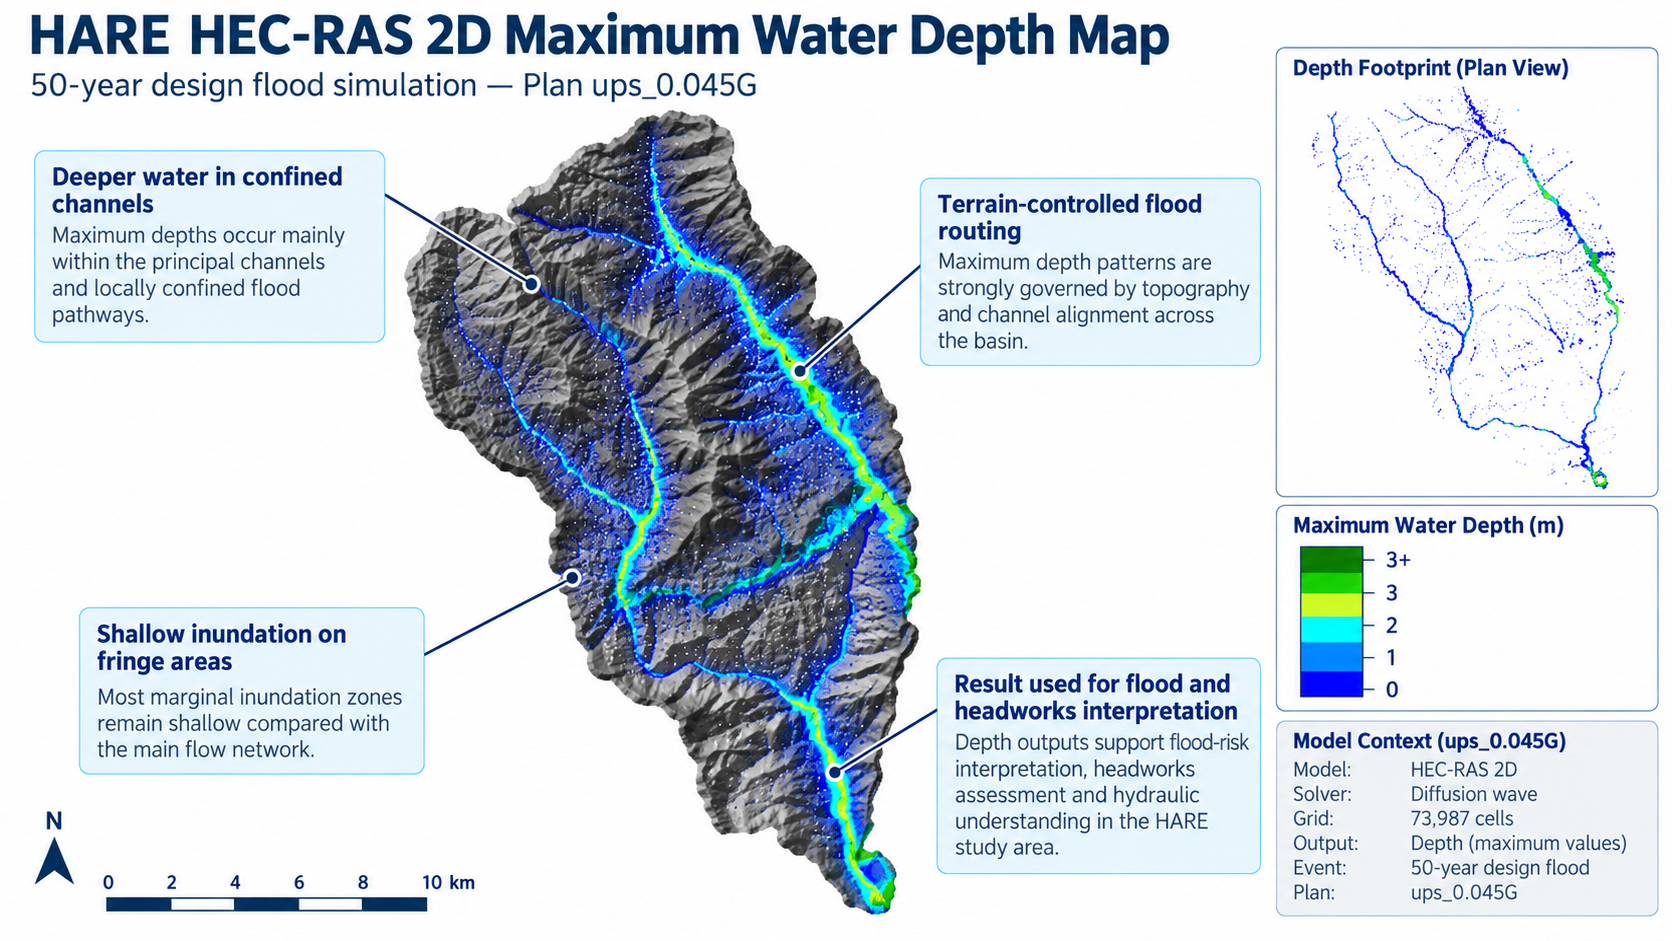
Maximum water-depth distribution showing deeper confined flow along the main channels and shallower inundation toward the margins.
The reconstructed headworks geometry combines terrain interpretation, field observations, canal-section design and hydraulic reasoning. Approximate levels are used to explain how the weir raises water for diversion while a lower sediment-control pathway helps remove sediment-laden bottom flow.
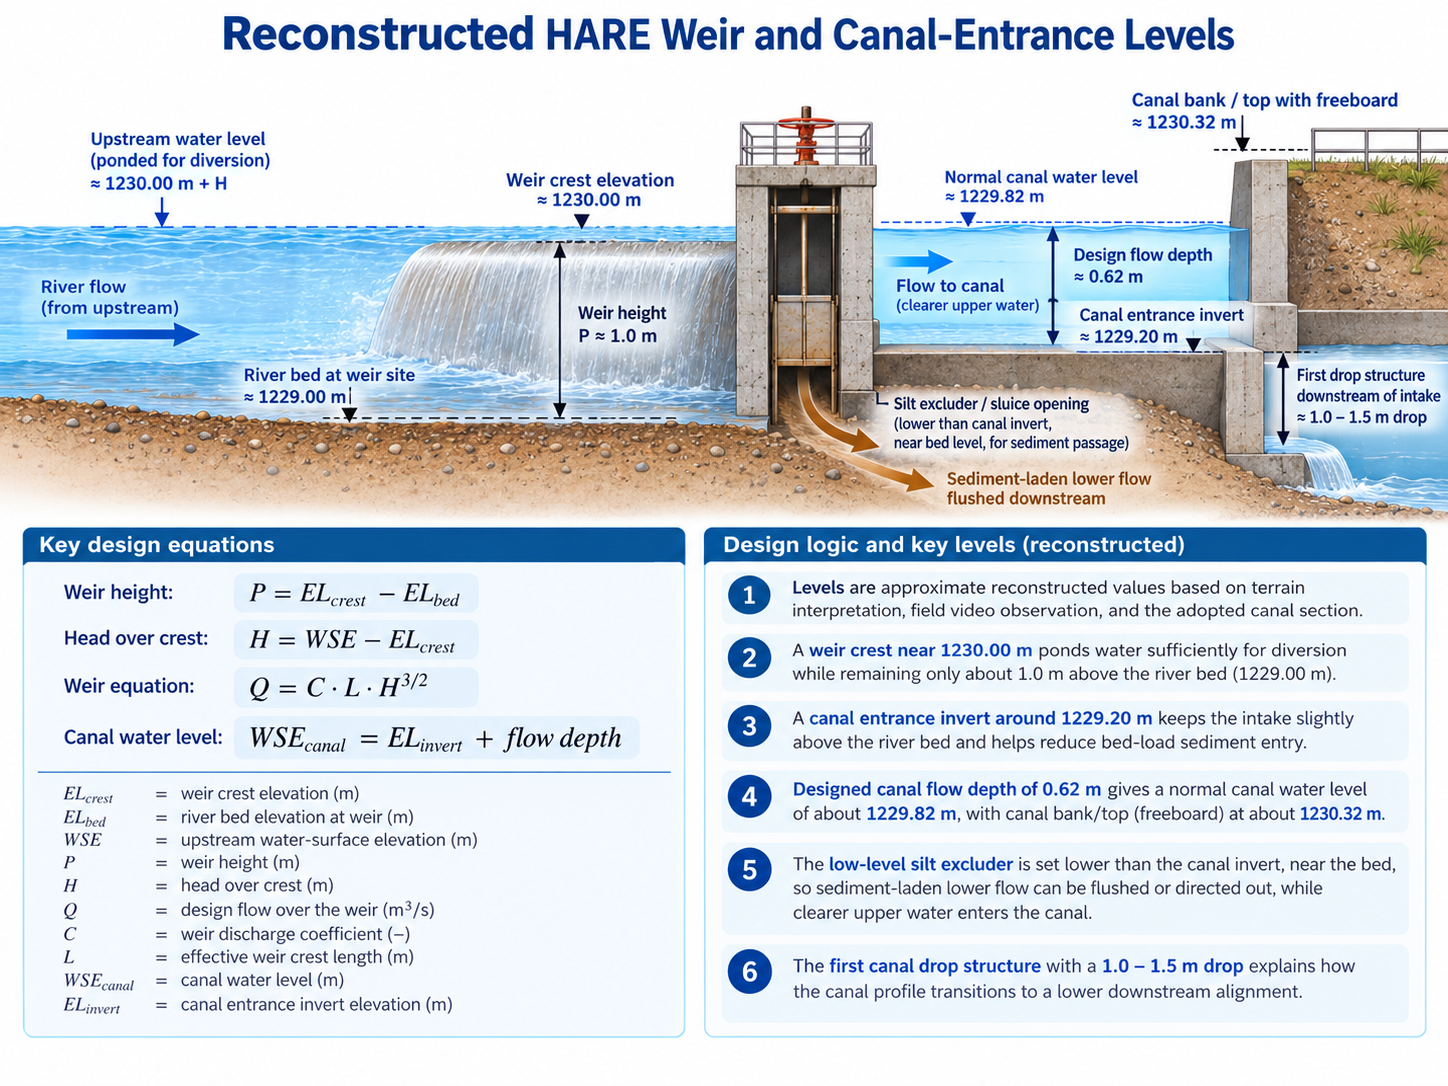
Approximate reconstruction showing river-bed level, weir crest, canal-entry invert, normal canal water level, low-level sediment excluder and the first downstream canal drop.
Additional HEC-RAS figures and supporting model-development material are available in the HARE model gallery.