Watershed
161.95 km²
Continuous watershed model represented by 17 subbasins.
Two continuous SWAT simulations have now been completed for the approximately 161.95 km² Hare River watershed. The model represents 17 hydrologically connected subbasins and uses daily meteorological forcing for the period 2020–2025.
The present results provide an initial continuous assessment of watershed runoff, evapotranspiration, subsurface flow, groundwater contribution, daily Hare River discharge, upland erosion and sediment routing.
The two simulations produced similar overall water-balance and sediment behaviour, providing a useful preliminary stability check on the current model configuration.
161.95 km²
Continuous watershed model represented by 17 subbasins.
211.6 m³/s
Largest outlet daily flow identified in Simulation 1, occurring on 15 April 2024.
58.4 Mg/ha
Average upland sediment yield from Simulation 2.
96.23%
Strong depositional behaviour identified by the SWAT sediment diagnostics.
267.63 mm
Basin-average surface runoff from Simulation 2.
182.06 mm
Simulated groundwater contribution to streamflow in Simulation 2.
| Setting | Current SWAT Configuration |
|---|---|
| Watershed area | 161.95 km² |
| Subbasins | 17 |
| Climate period | 1 January 2020 – 31 December 2025 |
| Warm-up period | 2020 |
| Primary interpretation period | 2021–2025 |
| Output time step | Daily |
| Precipitation method | Daily NASA POWER climate forcing |
| Weather source | NASA POWER, 16 spatial grid points |
| Simulation 1 | Initial continuous baseline simulation |
| Simulation 2 | Hare-specific weather-generator assignment |
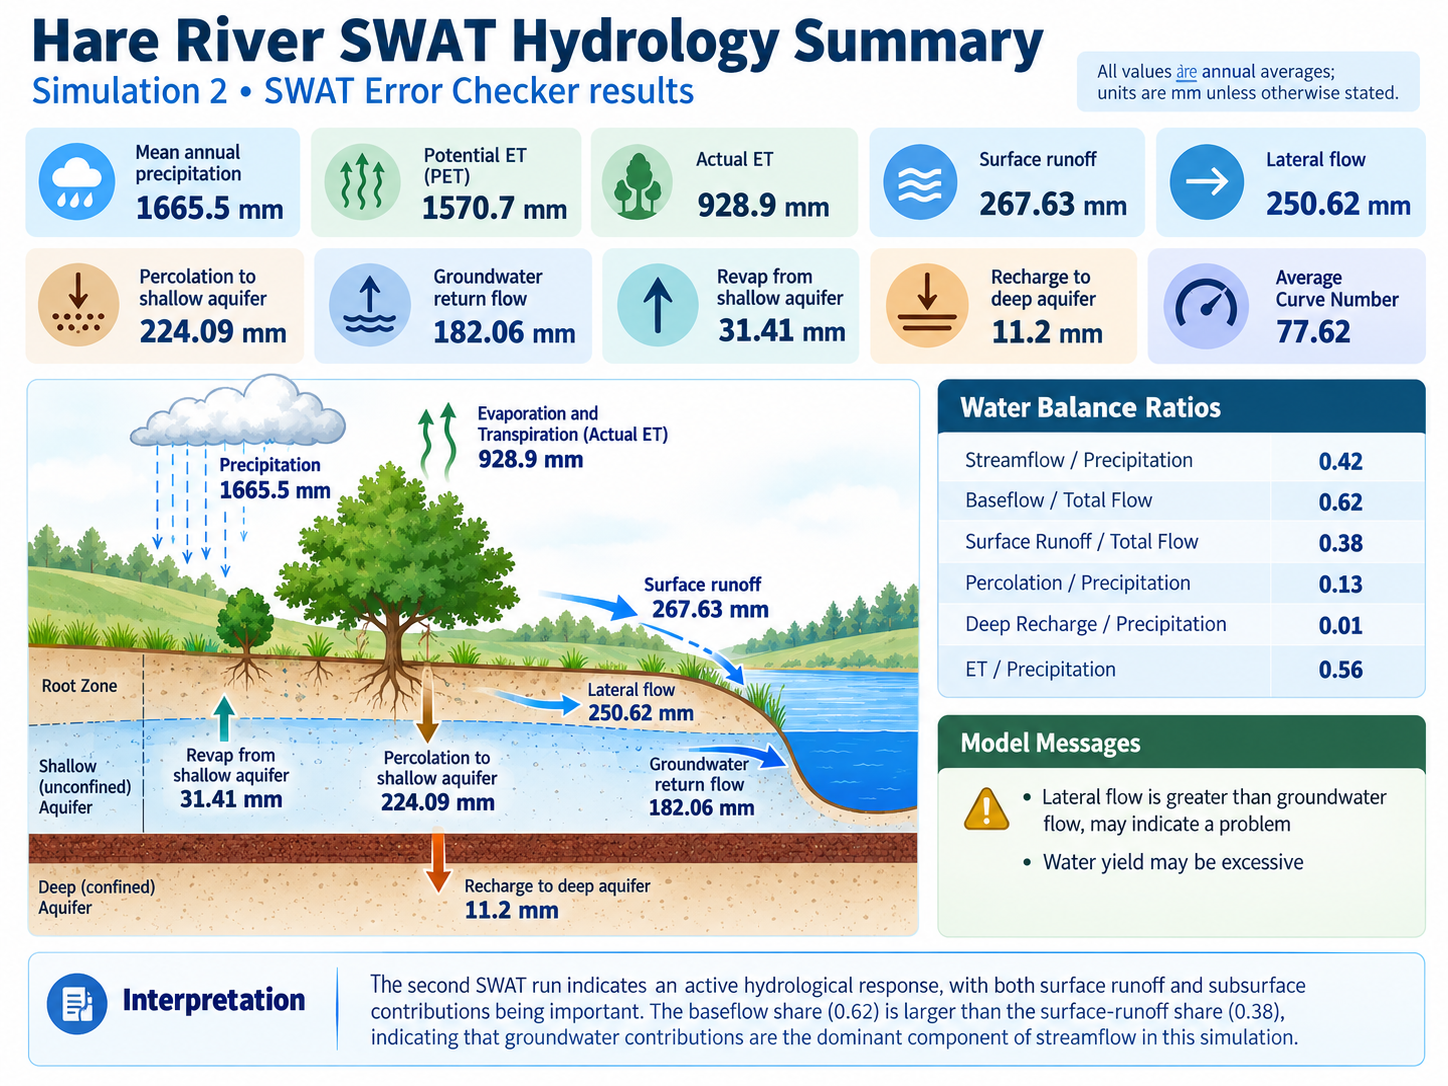
The second simulation produced a water balance very similar to the first run. This indicates that the principal watershed response was not substantially changed by the Hare-specific weather-generator assignment.
| Water-Balance Component | Simulation 1 | Simulation 2 | Change |
|---|---|---|---|
| Precipitation | 1665.50 mm | 1665.50 mm | 0.00 mm |
| Potential evapotranspiration | 1570.70 mm | 1570.70 mm | 0.00 mm |
| Actual evapotranspiration | 955.50 mm | 928.90 mm | −26.60 mm |
| Surface runoff | 262.27 mm | 267.63 mm | +5.36 mm |
| Lateral flow | 247.20 mm | 250.62 mm | +3.42 mm |
| Percolation | 209.48 mm | 224.09 mm | +14.61 mm |
| Groundwater return flow | 168.60 mm | 182.06 mm | +13.46 mm |
| Deep recharge | 10.47 mm | 11.20 mm | +0.73 mm |
| Average Curve Number | 77.62 | 77.62 | No change |
| Average upland sediment yield | 59.15 Mg/ha | 58.40 Mg/ha | −0.75 Mg/ha |
0.42
Approximately 42% of precipitation contributes to simulated water yield.
0.56
Approximately 56% of precipitation is represented as actual evapotranspiration.
0.62
Groundwater and subsurface processes form an important part of the simulated streamflow.
0.38
Surface runoff represents approximately 38% of simulated flow.
0.13
Approximately 13% of precipitation percolates beyond the soil profile in the simulation.
0.01
Only a small portion of precipitation reaches the deep aquifer.
The infographic below summarizes the principal hydrological results reported by the SWAT Error Checker for Simulation 2, including precipitation, evapotranspiration, surface runoff, lateral flow, percolation, groundwater return flow and the principal water-balance ratios.
The monthly SWAT results show strong seasonal variation in rainfall, surface runoff, subsurface flow, water yield, evapotranspiration and sediment production.
| Month | Rainfall (mm) |
Surface Runoff (mm) |
Lateral Flow (mm) |
Water Yield (mm) |
Actual ET (mm) |
Sediment Yield |
|---|---|---|---|---|---|---|
| January | 44.10 | 15.81 | 5.35 | 33.72 | 39.20 | 1.07 |
| February | 40.43 | 2.70 | 3.18 | 10.13 | 43.98 | 1.56 |
| March | 152.88 | 28.18 | 16.82 | 46.60 | 107.67 | 8.20 |
| April | 332.13 | 76.62 | 50.13 | 131.68 | 120.38 | 14.67 |
| May | 218.20 | 32.16 | 39.87 | 92.20 | 113.89 | 7.39 |
| June | 106.50 | 4.83 | 12.54 | 38.88 | 94.41 | 1.03 |
| July | 117.42 | 5.48 | 15.10 | 35.08 | 75.85 | 1.16 |
| August | 119.09 | 10.44 | 20.10 | 44.09 | 66.62 | 3.11 |
| September | 126.06 | 7.47 | 18.42 | 40.59 | 68.97 | 2.00 |
| October | 221.84 | 36.59 | 43.12 | 103.29 | 83.48 | 8.22 |
| November | 152.40 | 46.79 | 23.48 | 105.20 | 66.64 | 9.86 |
| December | 34.20 | 0.54 | 2.50 | 30.08 | 47.43 | 0.13 |
April is the dominant month in the present simulation, with approximately 332.13 mm of rainfall, 76.62 mm of surface runoff and 131.68 mm of water yield.
A second period of strong hydrological response occurs during October and November.
Reach 17 represents the downstream outlet of the current SWAT watershed and has a contributing area of approximately 161.9 km², corresponding closely to the Hare Weir catchment.
The annual maximum daily outlet flows identified from the first continuous SWAT simulation are:
| Year | Date | Maximum Daily Flow | Interpretation |
|---|---|---|---|
| 2021 | 1 January 2021 | 113.2 m³/s | Influenced by the large rainfall event at the end of the 2020 warm-up period. |
| 2022 | 16 April 2022 | 78.75 m³/s | Annual maximum daily flow. |
| 2023 | 17 November 2023 | 64.18 m³/s | Annual maximum daily flow. |
| 2024 | 15 April 2024 | 211.6 m³/s | Largest daily discharge in the current simulation. |
| 2025 | 10 March 2025 | 70.28 m³/s | Annual maximum daily flow. |
The HARE reassessment uses SWAT and HEC-HMS for complementary purposes rather than treating them as identical hydrological models.
| Model | Key Result | Meaning |
|---|---|---|
| HEC-HMS | 50-year event peak: 114.4 m³/s | Event-based design-flood hydrograph at the Hare Weir. |
| SWAT | Maximum current simulated daily flow: 211.6 m³/s | Continuous daily watershed response during the 2020–2025 simulation period. |
The numerical values should not be interpreted as directly comparable peak statistics. HEC-HMS resolves an event hydrograph at a much shorter computational interval, while the current SWAT output represents daily average simulated discharge.
Sediment behaviour has emerged as one of the most important findings from the first Hare SWAT simulations.
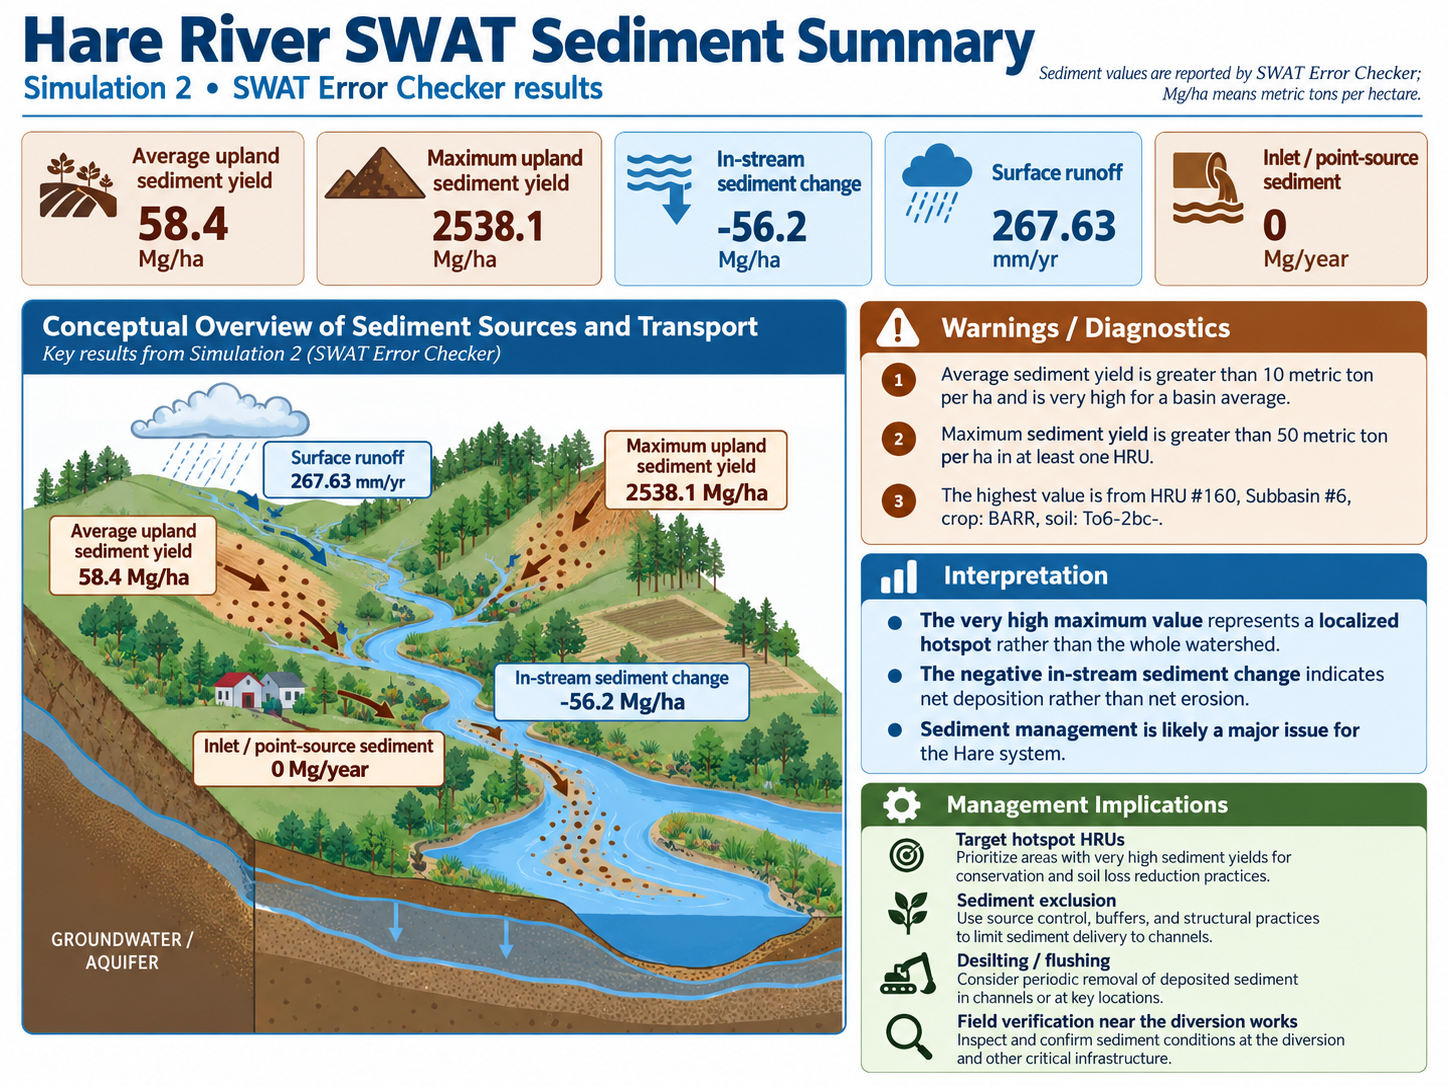
58.4 Mg/ha
Simulation 2 basin-average upland sediment yield.
2,538.1 Mg/ha
Maximum simulated upland sediment yield identified by the SWAT Error Checker.
96.23%
Error Checker indication of very strong sediment deposition within the simulated stream system.
1 Mg = 1 metric tonne = 1,000 kg
The simulated in-stream sediment change in Simulation 2 was approximately −56.2 Mg/ha. The negative value indicates that the model is representing substantial net sediment deposition within the channel system rather than simple downstream transport of all eroded material.
The sediment infographic summarizes the principal SWAT Error Checker outputs from Simulation 2 and shows how upland erosion, runoff, channel transport and deposition are interpreted within the Hare watershed.
The SWAT land-use summary shows that erosion is not distributed uniformly across the watershed.
| SWAT Land Use | Approx. Area | Curve Number | Surface Runoff | Sediment Yield |
|---|---|---|---|---|
|
AGRL Agricultural land |
42.37 km² | 83.00 | 381.43 mm | 165.47 Mg/ha |
|
BARR Bare ground |
0.58 km² | 91.00 | 663.81 mm | 1,549.33 Mg/ha |
|
FRST Forest |
55.76 km² | 73.00 | 166.62 mm | 0.77 Mg/ha |
|
RNGB Range brush |
18.97 km² | 74.00 | 171.92 mm | 21.96 Mg/ha |
|
RNGE Range grasses |
33.56 km² | 79.00 | 265.62 mm | 31.91 Mg/ha |
The most striking result is the BARR bare-ground class. It occupies only approximately 0.58 km², but the model assigns it a very high runoff response and localized sediment yield.
160
Highest simulated upland sediment-yield HRU identified in the present analysis.
6
The erosion hotspot is located within SWAT Subbasin 6.
BARR
Bare or exposed ground forms the dominant modelled erosion condition.
This result provides a clear target for future spatial review. HRU 160 can be compared with satellite imagery, slope, land-cover condition and field observations to determine whether the simulated erosion hotspot corresponds to a physically disturbed or exposed area.
The SWAT sediment results can now be considered together with current field photographs and video of the existing Hare diversion structure.

Present Sedimentation Condition at the Hare Diversion Weir. Field observations show substantial sediment accumulation both upstream and downstream of the structure. Deposited gravel, sand and finer material occupy a large part of the river section, while the present active flow is confined to a much narrower channel.
The photographs do not provide a direct measurement of sediment depth, deposited volume or annual sediment load. Nevertheless, they provide independent physical evidence that sediment transport and deposition are important processes at the diversion site.
The combined watershed modelling and field evidence indicates that sediment management should be treated as a principal design issue in any reassessment or rehabilitation of the Hare diversion headworks.
The reconstructed design should therefore examine the adequacy and arrangement of sediment-control measures including:
Final hydraulic sizing of these measures will require additional information including sediment grain-size distribution, sediment concentration, intake geometry, design canal discharge, river-water levels and available flushing discharge.
The SWAT Error Checker provides useful screening indicators for model interpretation. These warnings do not by themselves demonstrate that a parameter value is incorrect.
| Diagnostic | Current Result | Interpretation |
|---|---|---|
| Lateral flow | 250.62 mm | Error Checker notes relatively strong lateral-flow contribution. |
| Groundwater return flow | 182.06 mm | Lower than lateral flow; flagged for future calibration review. |
| Water yield | Screening warning | The model may be producing relatively high water yield. |
| Channel sediment deposition | 96.23% | Very strong modelled depositional behaviour; important for sediment assessment. |
| Bare-ground erosion | Very high | BARR class identified as a major localized erosion hotspot. |
The present SWAT results describe the behaviour of the current model configuration. They are not yet formal calibration results.
The current meteorological forcing covers 2020–2025, whereas the historical Hare River discharge observations recovered from the original project study cover 1980–1990.
Those two periods cannot be compared directly as an observed-versus- simulated calibration series.
Future formal calibration should reconstruct daily historical climate forcing for the period of the original river-flow observations and run the same watershed and HRU configuration for the matching historical period.
The first two Hare River SWAT simulations provide a coherent preliminary picture of the watershed's hydrological and sediment behaviour.
DEM + Land Use + Soil + Slope
↓
17 Subbasins + HRUs
↓
Daily Climate 2020–2025
↓
Continuous SWAT Simulation
↓
Water Balance + Streamflow + Sediment
↓
Field Verification
↓
Hare Headworks Assessment
DEM processing, stream definition and the 17-subbasin watershed configuration.
Land-use, soil and slope overlay and HRU-scale erosion response.
NASA POWER climate preparation and the 16-point weather grid.
Historical flow benchmarks, limitations and the future calibration strategy.