Dependable Flow and Irrigation Water Requirement
Irrigation design requires more than knowledge of the average river flow. The designer must determine how much water can be relied upon during critical low-flow periods, compare that dependable supply with crop water demand, and identify when continuous irrigation, rotational scheduling or storage is required.
Water Requirement and Water Availability Must Be Analysed Together
Irrigation planning contains two different but connected calculations. The first determines how much water the crop and irrigation system require. The second determines how much river water can be supplied reliably during the critical irrigation period.
Demand Side
Crop evapotranspiration, effective rainfall and irrigation efficiency are used to determine the quantity of irrigation water that must ultimately be supplied.
Supply Side
River-flow records are analysed to estimate dependable water availability during low-flow periods.
Net Irrigation Requirement
Net Irrigation Requirement (NIR) represents the depth of irrigation water that must reach the crop root zone after taking account of effective rainfall and other useful contributions to crop water supply.
where:
NIR = net irrigation requirement;
ETc = crop evapotranspiration; and
Peff = effective rainfall.
Where soil-water contribution, groundwater contribution or other effective sources are significant, these may also be included in the root-zone water balance.
Gross Irrigation Requirement
The quantity of water diverted from a river or canal must normally be greater than the net crop requirement because water is lost during conveyance, distribution and field application.
where:
GIR = gross irrigation requirement;
NIR = net irrigation requirement; and
Eoverall = overall irrigation-system efficiency.
If separate efficiencies are used, overall efficiency may be expressed as the product of the individual efficiency components.
where Ec, Ed and Ea may represent conveyance, distribution and application efficiencies respectively, according to the terminology adopted for the particular irrigation system.
Dependable Flow
Average river discharge does not necessarily indicate the discharge that can be depended upon during the dry season. A strongly seasonal river may convey enormous quantities of water during the wet season but carry only a small fraction of this flow during the critical irrigation months.
Dependable flow therefore expresses river-water availability at a specified level of reliability.
Meaning of a 1-in-5-Year Low Flow
For a return period of:
therefore:
A 1-in-5-year low flow therefore has approximately a 20% annual probability of being equalled or fallen below by the selected annual low-flow statistic.
Its complementary probability is:
Thus, under the same statistical definition, the selected annual low-flow magnitude has approximately an 80% probability of being exceeded.
1-in-5-Year Low Flow Using Abbay River Data
Published monthly Abbay River flow data from Mulat and Moges (2014) provide a useful worked example. Their Table 2 gives monthly flow volumes for the historical years 1970–1978 in MCM/month.
For this demonstration, each monthly volume is first converted to mean monthly discharge:
where V is the monthly volume in MCM and D is the number of days in the month.
The minimum monthly mean discharge is then selected from each year. These annual minima are ranked from smallest to largest and assigned an empirical probability using the Weibull plotting position:
For the nine-year illustrative series:
↔ Swipe horizontally to see all table columns.
| Rank | Year | Annual Minimum Monthly Flow (m³/s) | Non-Exceedance Probability |
|---|---|---|---|
| 1 | 1973 | 117.61 | 10% |
| 2 | 1971 | 131.56 | 20% |
| 3 | 1975 | 134.26 | 30% |
| 4 | 1978 | 142.36 | 40% |
| 5 | 1974 | 145.06 | 50% |
| 6 | 1972 | 147.48 | 60% |
| 7 | 1977 | 149.69 | 70% |
| 8 | 1970 | 171.30 | 80% |
| 9 | 1976 | 177.08 | 90% |
The target probability for a 1-in-5-year low flow is:
From the ranked annual-minimum series:
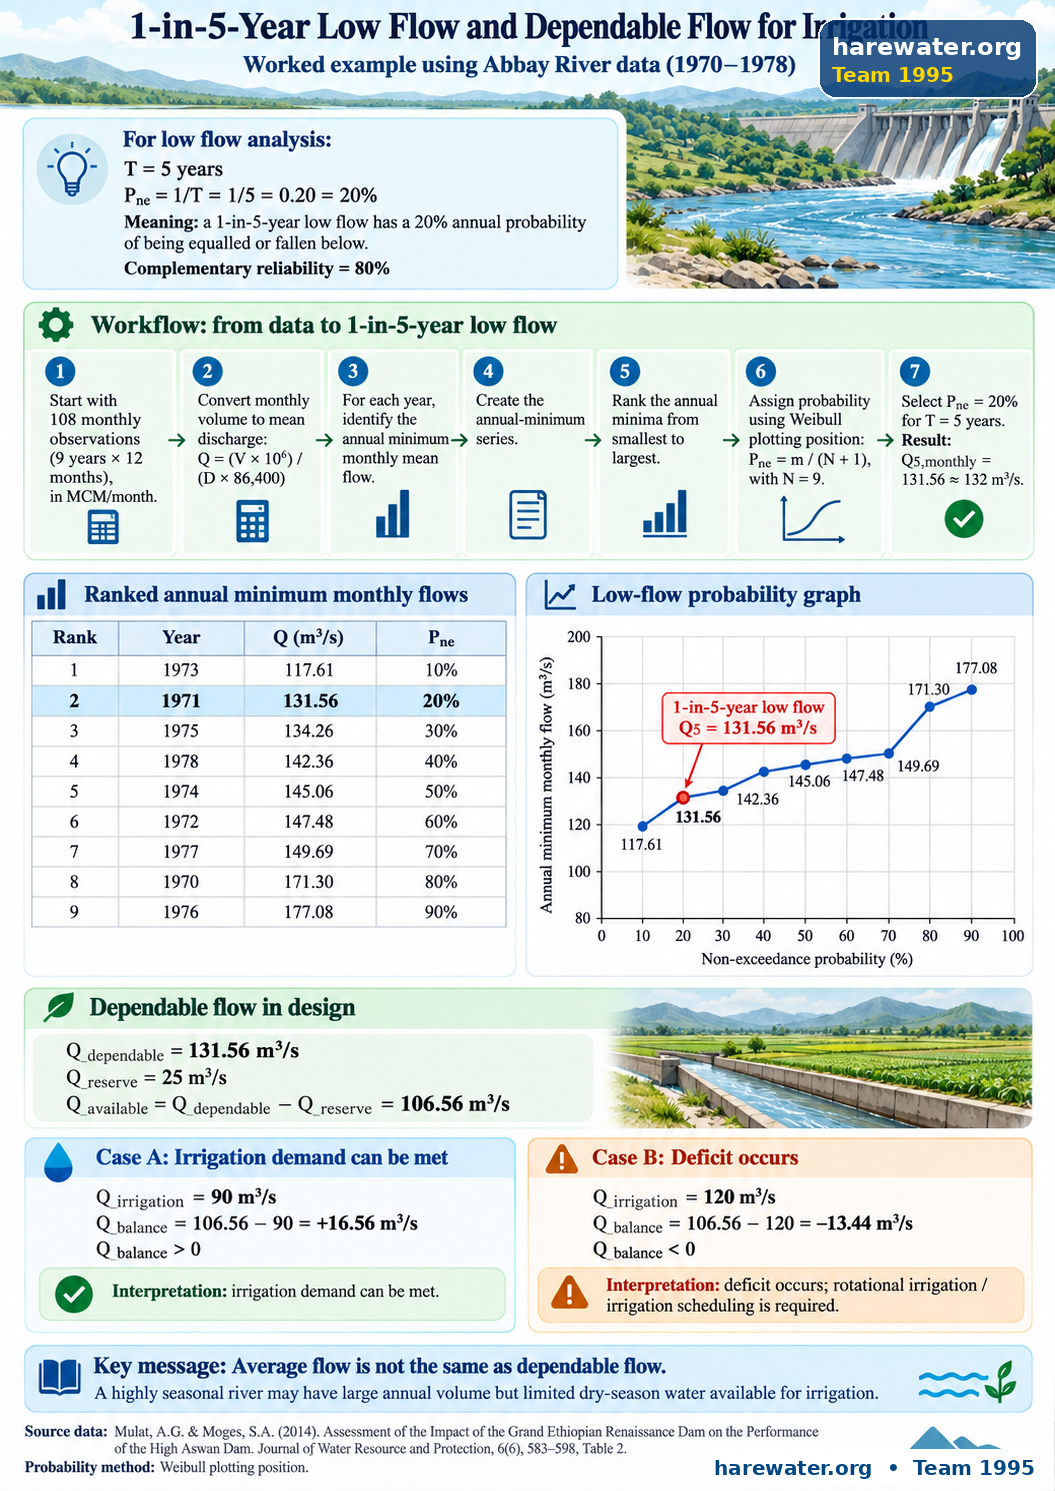
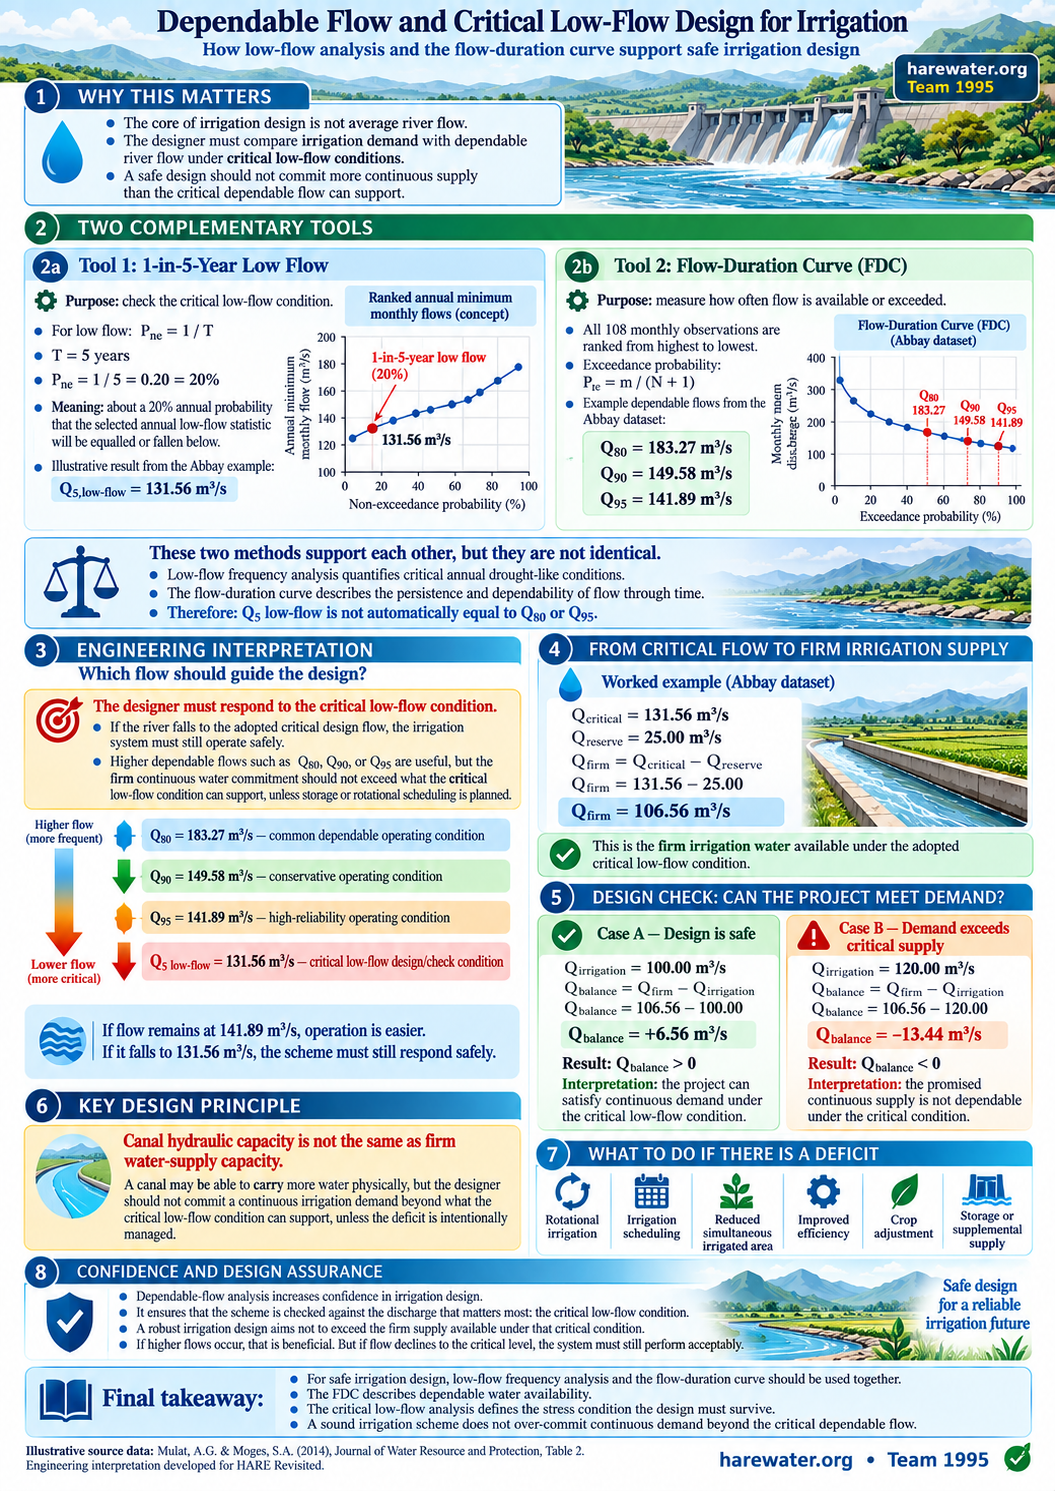
1-in-5-Year Low Flow and Dependable Flow for Irrigation
This slide shows how monthly river-flow data are converted to annual minimum flows, ranked by non-exceedance probability, and used to identify an illustrative 1-in-5-year monthly low flow of 131.56 m³/s. The critical flow is then reduced by reserved water requirements and compared with irrigation demand to determine whether the scheme has a surplus or deficit.
From Dependable River Flow to Available Irrigation Flow
The entire dependable river discharge should not automatically be assumed to be available for irrigation abstraction.
Water may need to remain in the river for environmental flow, downstream users, domestic requirements, livestock, existing abstractions and other legally or operationally reserved uses.
Using the illustrative example:
Water Balance and the Need for Irrigation Scheduling
The available dependable flow is compared directly with the irrigation requirement.
Case A — Water Supply Is Sufficient
Assume:
Qbalance > 0
The dependable available river flow exceeds the irrigation requirement. Continuous supply is theoretically possible under the adopted assumptions.
Case B — Deficit Occurs
Assume:
Qbalance < 0
Continuous unrestricted irrigation cannot be maintained. Irrigation scheduling or another management response is required.
Possible responses to a negative water balance
Where dependable supply is smaller than irrigation demand, possible responses include rotational irrigation, staggered irrigation periods, adjustment of the simultaneously irrigated area, improved conveyance and application efficiency, crop-pattern modification, supplemental storage or another appropriate operating strategy.
Qbalance > 0 → dependable supply exceeds irrigation demand.
Qbalance < 0 → irrigation demand exceeds dependable supply and scheduling or another management intervention is required.
1-in-5-Year Low Flow Is Not Automatically the Same as Q80
The approximately 80% reliability discussed in the worked example refers specifically to the probability that the selected annual minimum monthly-flow statistic remains above the 1-in-5-year low-flow value.
A conventional Q80 derived from a flow-duration curve has a different meaning. It represents a discharge that was equalled or exceeded for approximately 80% of all selected time steps in the historical record.
1-in-5-Year Monthly Low Flow
Derived from one annual minimum monthly-flow value per year.
Q80 Flow-Duration Discharge
Derived by ranking the selected flows across the complete period of record.
The two percentages may appear complementary, but the underlying statistical populations and hydrological interpretations are different.
Dependable Flow Connects Hydrology with Irrigation Operation
Irrigation planning should not be based only on average annual river discharge or total annual water volume. The decisive question is whether sufficient water remains available during the critical irrigation period at the reliability required by the project.
Source Used in the Worked Example
The 1-in-5-year calculation presented on this page is an educational frequency-analysis example developed from the published data. It is not presented as a definitive design low-flow estimate for the Abbay River. A formal project design should use the complete available long-term hydrological record.