Storm Duration
24 hours
The complete design rainfall depth is distributed through one day.
This page presents the rainfall datasets and design-storm inputs used in the HARE hydrological reconstruction. It distinguishes the corrected CHIRPS 1981–2025 annual-maxima analysis, the earlier HEC-HMS model storm, and the more recent provisional flood-design assessment. These are not interchangeable datasets or automatically equivalent model runs.
| Analysis / scenario | Rainfall information | Peak discharge | Status |
|---|---|---|---|
| Corrected CHIRPS annual maxima (1981–2025) | Gumbel P50 daily = 98.92 mm | Not established from this rainfall fit alone | Reported rainfall frequency analysis |
| Earlier HEC-HMS 50-year event | Model input P24 = 58.98 mm | 114.4 m³/s | Archived model output |
| Updated 2026 working headworks flood | Exact rainfall/model linkage to confirm | 195.2 m³/s | Provisional design reference |
| HEC-RAS rainfall-on-grid assessment | Reported 70.9 mm event | Use hydraulic results at their identified locations | Separate 2D hydraulic scenario |
Read the HEC-HMS Results, HEC-RAS hydraulic assessment, IMERG-based IDF analysis and Headworks design alongside this record.
Assemble and quality-check the daily rainfall record for the Hare watershed, including dates, units, missing values and spatial coverage.
Identify the largest daily catchment-average rainfall event in each year and build the annual-maximum series used for frequency analysis.
Estimate return-period rainfall depths from the annual-maximum rainfall series.
Convert the selected design depth into incremental time blocks that sum to the required storm rainfall.
Enter the final storm distribution using the adopted computation interval and run the design-event simulations.
The earlier analysis used an initial 1981–1990 trial series to establish
the extraction procedure. This is historical method development,
not the adopted 2026 rainfall-frequency record. The
uploaded file does not define the $annualMaxRain array;
the table below therefore displays data only if that array is supplied
by the website.
| Year | Date | Area Mean (mm/day) | Max Pixel (mm/day) |
|---|---|---|---|
| 1981 | 1981-07-30 | 41.91 | 47.53 |
| 1982 | 1982-11-28 | 36.96 | 50.24 |
| 1983 | 1983-07-25 | 44.14 | 53.13 |
| 1984 | 1984-05-29 | 58.47 | 78.82 |
| 1985 | 1985-05-23 | 38.84 | 45.39 |
| 1986 | 1986-08-10 | 42.46 | 62.06 |
| 1987 | 1987-05-21 | 44.09 | 53.02 |
| 1988 | 1988-05-19 | 44.69 | 59.12 |
| 1989 | 1989-10-20 | 50.46 | 65.59 |
| 1990 | 1990-07-21 | 52.13 | 70.87 |
The rainfall analysis was later extended and corrected using the true Hare Weir catchment represented by the final HEC-HMS basin model. The corrected catchment area is 162.035 km², and the complete CHIRPS record contains 45 years from 1981 through 2025.
For every calendar year, the complete daily CHIRPS series was searched and the date having the greatest spatial mean rainfall over the Hare Weir catchment was selected. The result is one annual maximum daily catchment-average rainfall value for each year.
This value is especially important because it is not a single high-value pixel. It is the daily spatial average over the complete 162.035 km² Hare Weir catchment on the wettest catchment-average day found in the full 1981–2025 record.
The reported corrected 45-value annual-maximum CHIRPS series was used for the Gumbel frequency analysis of the 162.035 km² Hare Weir catchment. These rainfall quantiles are daily depths; their use as continuous 24-hour storm totals requires an explicit duration-conversion policy.
| Return Period | Corrected Gumbel Rainfall (mm) |
|---|---|
| 2 years | 55.92 |
| 5 years | 69.70 |
| 10 years | 78.83 |
| 25 years | 90.36 |
| 50 years | 98.92 |
| 100 years | 107.41 |
The following 24-hour depths belong to the earlier HEC-HMS input series. They are retained for reproducibility, not adopted automatically as the rainfall basis for the revised 195.2 m³/s flood. The 10-, 25-, and 100-year values are recorded as prepared inputs rather than verified new model peaks.
| Return Period | Earlier input-series P24 (mm) | Model Status |
|---|---|---|
| 10 years | 49.61 | Historical prepared rainfall input |
| 25 years | 54.99 | Historical prepared rainfall input |
| 50 years | 58.98 | Used in archived 114.4 m³/s run |
| 100 years | 62.95 | Historical prepared rainfall input |
An event-based HEC-HMS simulation requires a rainfall time series, rather than a single daily or 24-hour total. A selected and verified storm depth is distributed into shorter-duration increments, while preserving the event total and documenting any daily-to-24-hour duration adjustment.
24 hours
The complete design rainfall depth is distributed through one day.
15 minutes
The archived HEC-HMS design event is reported at a 15-minute computation interval.
72 hours
The archived page reports a 72-hour window; verify the duration for the updated run separately.
Σ incremental rainfall = selected storm depth
The final hyetograph must reproduce the adopted event total.
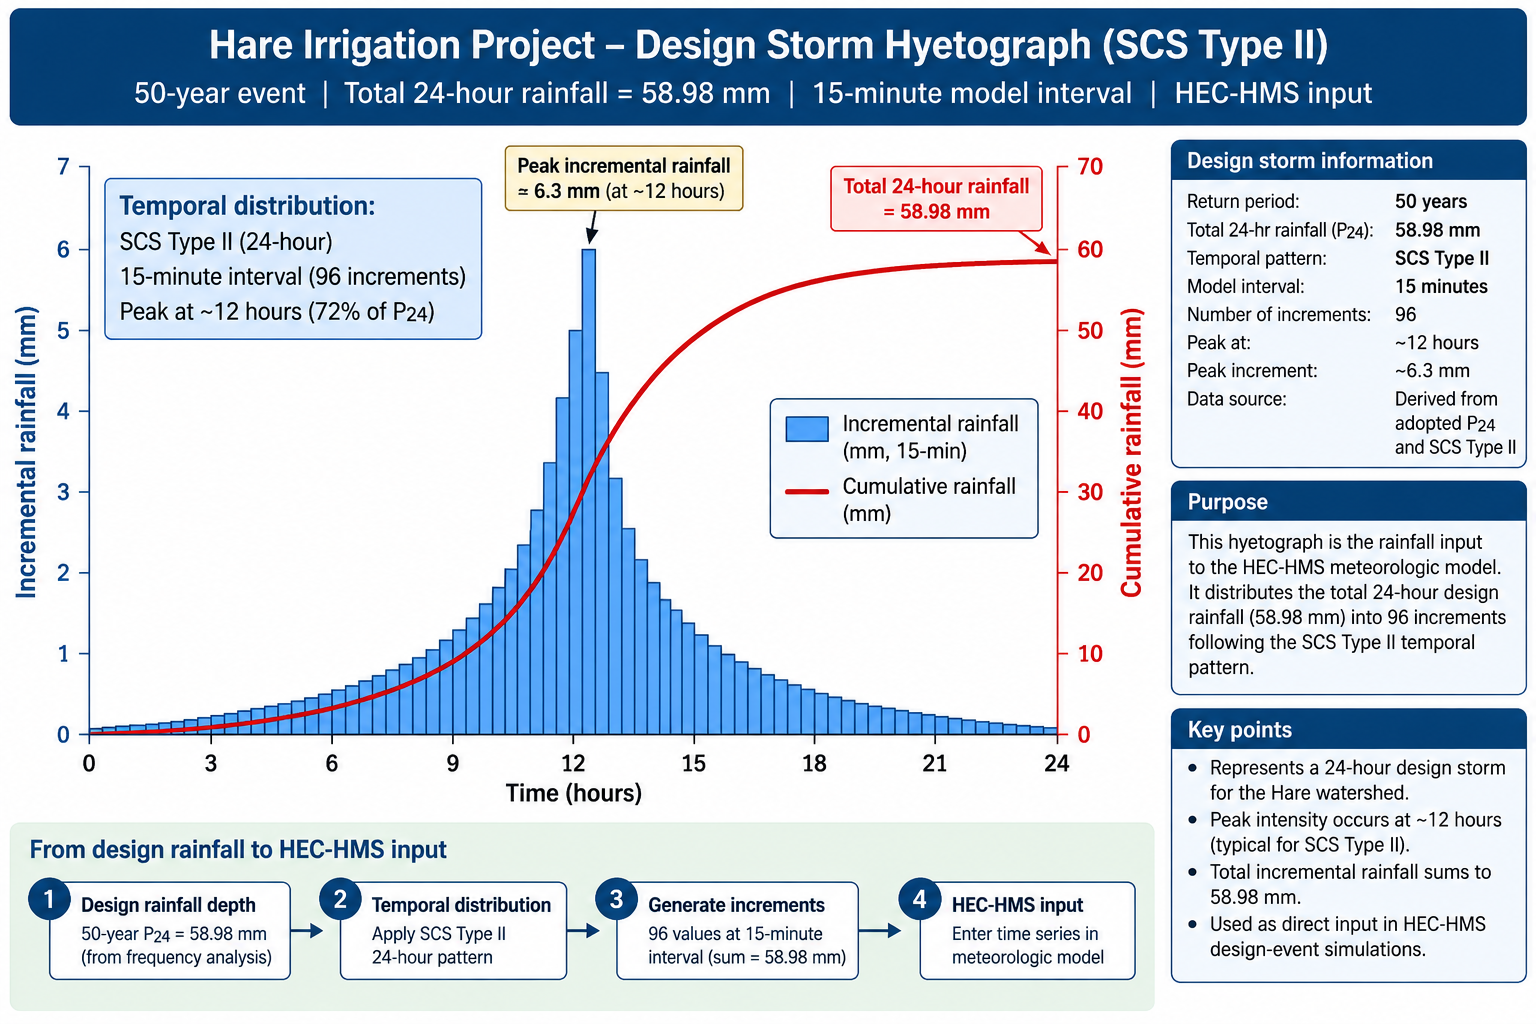
The existing figure is the archived 50-year HEC-HMS input, with 58.98 mm over 24 hours represented using the SCS Type II temporal pattern at a reported 15-minute model interval. It does not document the rainfall input that generated the newer working 195.2 m³/s flood peak.
The blue bars represent incremental rainfall applied during each model time step, while the cumulative curve shows the progressive total rainfall through the storm. The sum of all incremental rainfall blocks is equal to the adopted 24-hour design depth.
The supplementary corrected annual-maximum table, Gumbel calculations and depth-duration discussion are included when the corresponding PHP files are available in this HEC-HMS folder. Their presence does not establish the rainfall provenance of the revised 195.2 m³/s discharge.